OPEN-SOURCE SCRIPT
Weighted Momentum and Volatility Indicator (WMI)
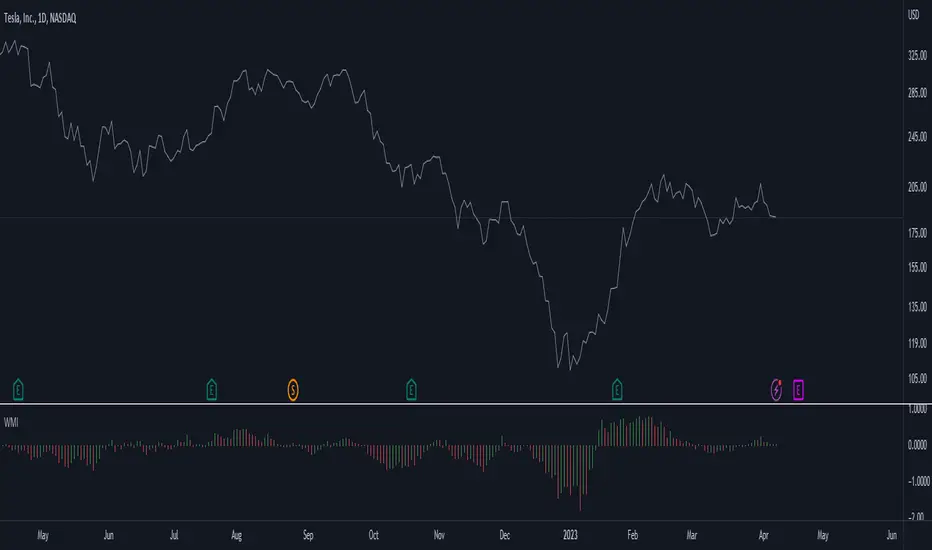
The Weighted Momentum and Volatility Indicator (WMI) is a composite technical analysis tool that combines momentum and volatility to identify potential trend changes in the underlying asset.
The WMI is displayed as an histogram that oscillates around a zero line, with increasing bars indicating a bullish trend and decreasing bars indicating a bearish trend.
The WMI is calculated by combining the Rate of Change (ROC) and Average True Range (ATR) indicators.
The ROC measures the percentage change in price over a set period of time, while the ATR measures the volatility of the asset over the same period.
The WMI is calculated by multiplying the normalized values of the ROC and ATR indicators, with the normalization process being used to adjust the values to a scale between 0 and 1.
Traders and investors can use the WMI to identify potential trend changes in the underlying asset, with increasing bars indicating a bullish trend and decreasing bars indicating a bearish trend.
The WMI can be used in conjunction with other technical analysis tools to develop a comprehensive trading strategy.
Do not hesitate to let me know your comments if you see any improvements to be made :)
Script de código abierto
Fiel al espíritu de TradingView, el creador de este script lo ha convertido en código abierto, para que los traders puedan revisar y verificar su funcionalidad. ¡Enhorabuena al autor! Aunque puede utilizarlo de forma gratuita, recuerde que la republicación del código está sujeta a nuestras Normas internas.
Plan the trade ⚡ Trade the plan
Exención de responsabilidad
La información y las publicaciones no constituyen, ni deben considerarse como asesoramiento o recomendaciones financieras, de inversión, de trading o de otro tipo proporcionadas o respaldadas por TradingView. Más información en Condiciones de uso.