OPEN-SOURCE SCRIPT
last week high and low
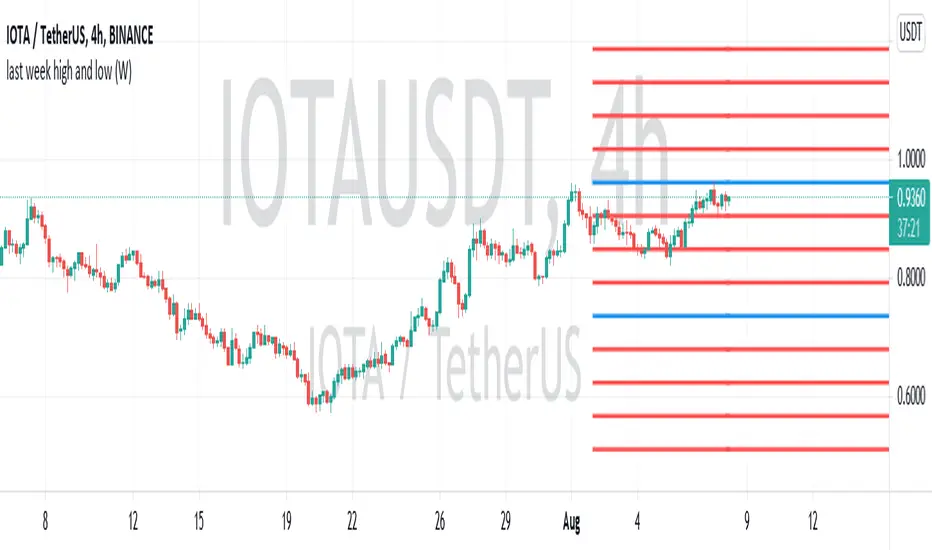
this script defines the highest and the lowest values of the last week. then illustrate and extend them into current week and future. they are define by blue lines.
in addition, the distance between high and low divided by 4. interior and exterior regions are split by these lines (red lines)
all lines can be considered as static support/resistance.
in addition, the distance between high and low divided by 4. interior and exterior regions are split by these lines (red lines)
all lines can be considered as static support/resistance.
Script de código abierto
Fiel al espíritu de TradingView, el creador de este script lo ha convertido en código abierto, para que los traders puedan revisar y verificar su funcionalidad. ¡Enhorabuena al autor! Aunque puede utilizarlo de forma gratuita, recuerde que la republicación del código está sujeta a nuestras Normas internas.
Exención de responsabilidad
La información y las publicaciones no constituyen, ni deben considerarse como asesoramiento o recomendaciones financieras, de inversión, de trading o de otro tipo proporcionadas o respaldadas por TradingView. Más información en Condiciones de uso.