OPEN-SOURCE SCRIPT
Actualizado [w3ss1] Timeframe Sync
The "Timeframe Sync" indicator provides a comprehensive view of price action across multiple timeframes for a single symbol, allowing traders to analyze market conditions from a multi-timeframe perspective with ease.
Key Features:
Usage:
Ideal for traders who need a quick multi-timeframe analysis without switching charts.
Helps in confirming short-term moves with longer-term trends or spotting divergences across timeframes.
Instructions:
Add the indicator to your chart.
Customize the timeframes you wish to monitor via the toggle switches.
Optionally, select a different symbol if not analyzing the current chart's symbol.
Adjust colors and table settings to your preference.
Observe how price action behaves across different timeframes to make informed trading decisions.
Key Features:
- Flexible Symbol Selection: Choose between analyzing the symbol of the current chart or select another symbol to monitor.
- Customizable Timeframes: Control which timeframes you want to analyze through toggle switches. Choose from 11 different timeframes ranging from 1-minute to Monthly charts, with the ability to customize each one:
1m, 5m, 15m, 30m, 1H, 4H, 8H, 12H, 1D, 1W, 1M - Visual Feedback:
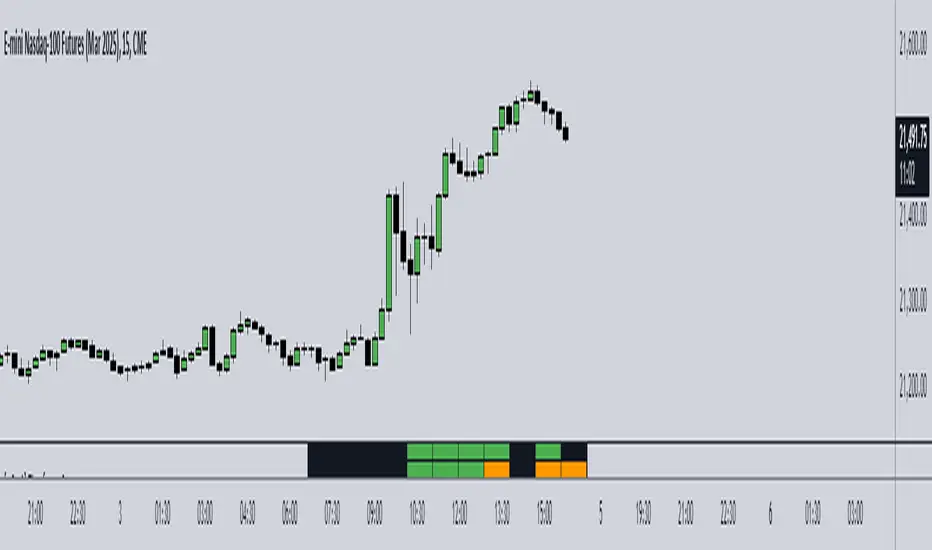
-Candle Close Color: Each timeframe's last closed candle is color-coded. Bullish closes are highlighted in green, bearish in dark shades, and inside candles in orange.
-Bias Indicator: The indicator shows whether the close is "above", "below", or "inside" the previous candle's high/low range, providing insight into the market's momentum. - Table Display: Information is presented in a clear table format:
-The first row shows the symbol being analyzed.
-The second row displays "Candle close" to indicate the relevance of the information below.
-Each subsequent row represents a different timeframe, showing its abbreviation and the bias of the last close. - Conditional Display: Timeframes are only shown if they are relevant to the current chart's timeframe. This ensures that you're not looking at outdated data when on lower timeframes.
- Customization:
-Adjust text size, table position, background color, text color, and colors for different candle close scenarios.
Usage:
Ideal for traders who need a quick multi-timeframe analysis without switching charts.
Helps in confirming short-term moves with longer-term trends or spotting divergences across timeframes.
Instructions:
Add the indicator to your chart.
Customize the timeframes you wish to monitor via the toggle switches.
Optionally, select a different symbol if not analyzing the current chart's symbol.
Adjust colors and table settings to your preference.
Observe how price action behaves across different timeframes to make informed trading decisions.
Notas de prensa
Extra info for usage:This indicator synchronizes and displays OHLC (Open, High, Low, Close) information from multiple timeframes on a single table, allowing traders to see how different timeframes interact with the current price action. It provides a visual summary in a table format, showing the direction of the last candle's close, and whether the close of each timeframe's previous candle is above, below, or within the range of the candle before that.
Use this indicator to get a snapshot of market sentiment across various timeframes, aiding in better trend analysis.
Script de código abierto
Fiel al espíritu de TradingView, el creador de este script lo ha convertido en código abierto, para que los traders puedan revisar y verificar su funcionalidad. ¡Enhorabuena al autor! Aunque puede utilizarlo de forma gratuita, recuerde que la republicación del código está sujeta a nuestras Normas internas.
Exención de responsabilidad
La información y las publicaciones no constituyen, ni deben considerarse como asesoramiento o recomendaciones financieras, de inversión, de trading o de otro tipo proporcionadas o respaldadas por TradingView. Más información en Condiciones de uso.