OPEN-SOURCE SCRIPT
Actualizado Simple Auto Trend Lines
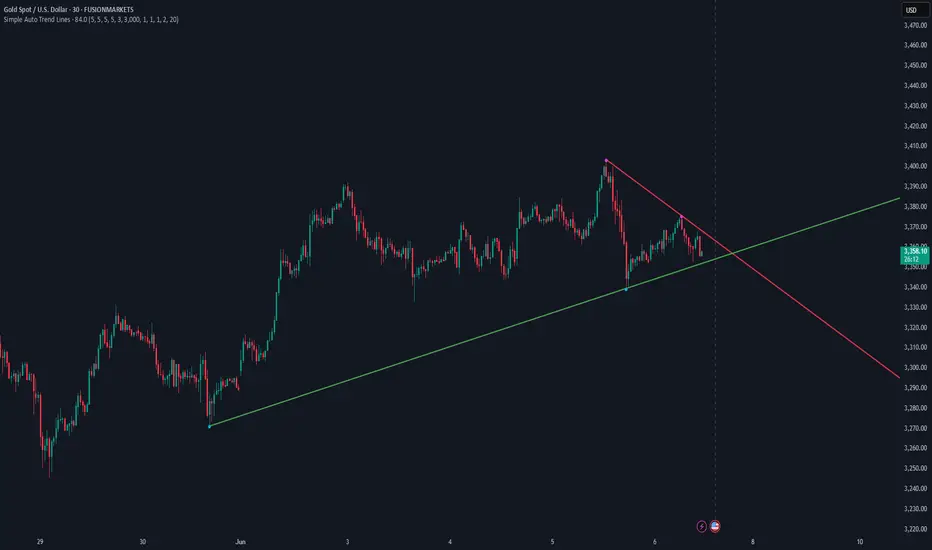
Opinionated way of drawing automatic trend lines. It draws automatically trend lines based on specified top/bottom strengths with multiple sets in order to keep track of multiple levels of interest.
Has the ability to hide invalidated trendlines if price moves away from it.
Has the ability to hide invalidated trendlines if price moves away from it.
Notas de prensa
Opinionated way of drawing automatic trend lines. It draws automatically trend lines based on specified top/bottom strengths with multiple sets in order to keep track of multiple levels of interest.Has the ability to hide invalidated trendlines if price moves away from it.
Notas de prensa
Fix: The requested historical offset (X) is beyond the historical buffer’s limit (Y)Notas de prensa
Fix: filter out some of the invalid trendlines where there are bars below green one and bars above red one between second pivot and current price - these are not good enough Notas de prensa
Add: line thickness settingNotas de prensa
Major Rework of the indicator. My motivation was to reduce the amount of fiddling required in order to automatically draw quality trendlines. As usual, it's my subjective opinion on how they should be drawn, but I hope you'll appreciate the end result.
Now you don't need to specify 5 sets of values. A single set of values (for each pivot highs and lows) should work just fine and highlight significant trendlines.
Added settings:
1. Candles to Cross for Invalidation - the number of candles to cross above/below for the trendline to disappear (Recommended: 2-3)
2. Max drawing distance (bars) - how many bars in the past the indicator will go to draw the lines. Higher value can result in indicator timeout due to tradingview computational limitations (Recommended: 500)
3. Max Lines Per Pivot - how many trendlines a single starting pivot can be made (Recommended: 1)
4. Max Resistance Trendlines - number of total resistance lines to reduce clutter (Recommended: 1)
5. Max Support Trendlines - number of total support lines to reduce clutter (Recommended: 1)
Added Alerts:
1. Resistance Trendline Crossed
2. Resistance Trendline Crossed & Closed Above
3. Support Trendline Crossed
4. Support Trendline Crossed & Closed Below
Note: alerts might not work as expected and need some testing. Will test it during the week and update the indicator if alerts don't work properly.
Note: lower pivot high/low values can result in indicator timing out due to tradingview computation limitations. Updating some settings should refresh the indicator to get going again. Increase the high/low values to reduce the likelihood of timeouts, but generally speaking it should perform well (based on my testing with high/low: 4 & 1000 bars max lookback).
Enjoy!
Notas de prensa
fixed: lines were disappearing when new candle printed. this should no longer happenNotas de prensa
Simple Auto Trend Lines automatically identifies and draws key trendlines on your chart by detecting significant pivot points in price action. Unlike manual trendline drawing that relies on subjective judgment, this indicator uses algorithmic pivot detection to create objective resistance and support trendlines.The indicator works by identifying pivot highs and lows using customizable lookback parameters, then connecting these pivots to form valid trendlines. A trendline is considered valid when no price action penetrates it between the connected pivot points. The script intelligently filters out invalid lines and prioritizes the most significant trendlines based on your settings.
Key features include:
- Automatic detection of resistance (red) and support (green) trendlines
- Customizable pivot detection sensitivity with separate settings for highs and lows
- Intelligent line validation that ensures trendlines aren't penetrated between pivot points
- Line break detection with alerts when price crosses or closes beyond a trendline
- Visual highlighting of pivot points with customizable colors and sizes
- Configurable maximum number of trendlines to prevent chart clutter
The indicator is particularly effective for identifying key price levels, trend channels, and potential reversal zones. Use it to objectively identify support/resistance areas, confirm trend direction, spot potential breakouts/breakdowns, and receive alerts when significant trendlines are breached.
Customize the settings to match your trading timeframe - tighter pivot settings for short-term trading and wider settings for longer-term analysis. The trendline break alerts can be especially valuable for timing entries and exits based on objective technical levels rather than subjective analysis.
Script de código abierto
Fiel al espíritu de TradingView, el creador de este script lo ha convertido en código abierto, para que los traders puedan revisar y verificar su funcionalidad. ¡Enhorabuena al autor! Aunque puede utilizarlo de forma gratuita, recuerde que la republicación del código está sujeta a nuestras Normas internas.
Exención de responsabilidad
La información y las publicaciones no constituyen, ni deben considerarse como asesoramiento o recomendaciones financieras, de inversión, de trading o de otro tipo proporcionadas o respaldadas por TradingView. Más información en Condiciones de uso.