OPEN-SOURCE SCRIPT
Actualizado Daily Moving Averages Oscillator
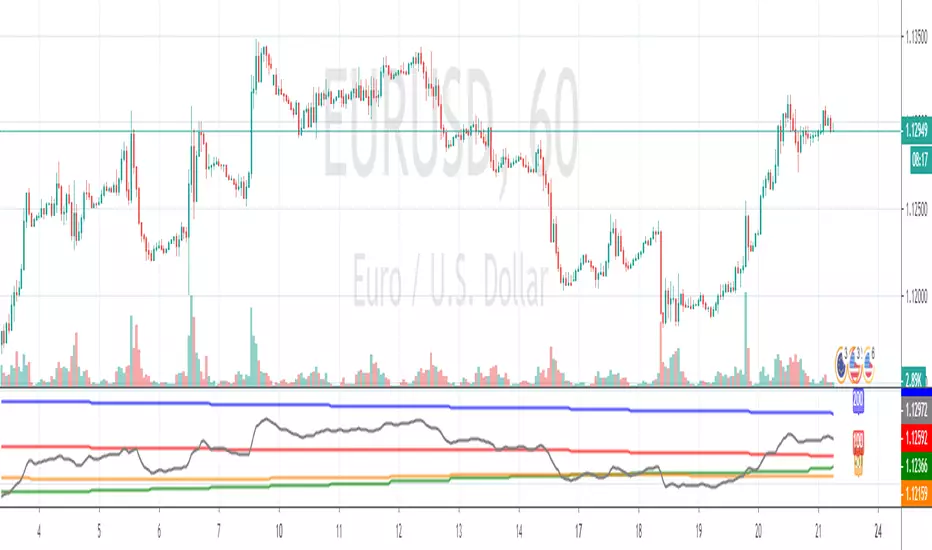
This is the best way I've found so far for gauging directional bias (i.e. overall trend) at-a-glance. It shows current price in black along with the 20, 50 & 100 daily MAs, all of which are visible at all times, and from all timeframes. No wondering where the 100MA is cause it's now showing on the chart. I also find this good for keeping my charts visually cleaner. Having the undulating lines moved underneath makes it easier for me to see support/resistance and other imporant stuff,
The trend is your friend and this helps to make sure you're on the right side of a trade.
The trend is your friend and this helps to make sure you're on the right side of a trade.
Notas de prensa
Fixed screenshotNotas de prensa
Added 200MA in blue, and 50 period Kijun (which is like a dynamic 50% fib) in brown, added some new options for hiding and offsetting the labelsScript de código abierto
Fiel al espíritu de TradingView, el creador de este script lo ha convertido en código abierto, para que los traders puedan revisar y verificar su funcionalidad. ¡Enhorabuena al autor! Aunque puede utilizarlo de forma gratuita, recuerde que la republicación del código está sujeta a nuestras Normas internas.
Exención de responsabilidad
La información y las publicaciones no constituyen, ni deben considerarse como asesoramiento o recomendaciones financieras, de inversión, de trading o de otro tipo proporcionadas o respaldadas por TradingView. Más información en Condiciones de uso.
Script de código abierto
Fiel al espíritu de TradingView, el creador de este script lo ha convertido en código abierto, para que los traders puedan revisar y verificar su funcionalidad. ¡Enhorabuena al autor! Aunque puede utilizarlo de forma gratuita, recuerde que la republicación del código está sujeta a nuestras Normas internas.
Exención de responsabilidad
La información y las publicaciones no constituyen, ni deben considerarse como asesoramiento o recomendaciones financieras, de inversión, de trading o de otro tipo proporcionadas o respaldadas por TradingView. Más información en Condiciones de uso.