OPEN-SOURCE SCRIPT
BOS & ChoCh Market Structure
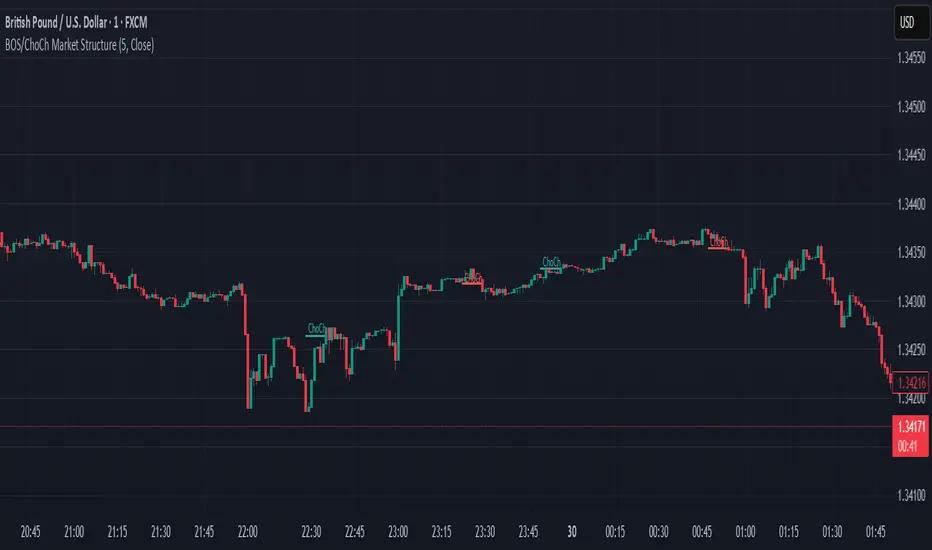
BOS/ChoCh Market Structure Indicator
This indicator identifies key market structure shifts using Break of Structure (BOS) and Change of Character (ChoCh) signals based on pivot point analysis.
Concept
Break of Structure (BOS) occurs when price breaks through a significant pivot level in the direction of the current trend, signaling trend continuation. A bullish BOS happens when price breaks above a pivot high while in an uptrend, while a bearish BOS occurs when price breaks below a pivot low during a downtrend.
Change of Character (ChoCh) signals a potential trend reversal. It occurs when price breaks against the prevailing trend - breaking above a pivot high while in a downtrend, or breaking below a pivot low while in an uptrend. This indicates the market structure is shifting.
How It Works
The indicator automatically detects swing highs and lows using configurable pivot strength. When price breaks these levels, it plots:
Settings
Pivot Strength - Number of candles on each side required to confirm a swing high/low (default: 5). Higher values identify more significant pivots but produce fewer signals.
Breakout Confirmation - Choose whether breakouts require a candle close beyond the level ("Close") or just a wick touch ("Wick").
Show BOS / Show ChoCh - Toggle visibility of Break of Structure and Change of Character signals independently.
Colors - Customize the colors for bullish (cyan) and bearish (red) signals.
Perfect for swing traders and market structure analysis.
This indicator identifies key market structure shifts using Break of Structure (BOS) and Change of Character (ChoCh) signals based on pivot point analysis.
Concept
Break of Structure (BOS) occurs when price breaks through a significant pivot level in the direction of the current trend, signaling trend continuation. A bullish BOS happens when price breaks above a pivot high while in an uptrend, while a bearish BOS occurs when price breaks below a pivot low during a downtrend.
Change of Character (ChoCh) signals a potential trend reversal. It occurs when price breaks against the prevailing trend - breaking above a pivot high while in a downtrend, or breaking below a pivot low while in an uptrend. This indicates the market structure is shifting.
How It Works
The indicator automatically detects swing highs and lows using configurable pivot strength. When price breaks these levels, it plots:
- Color-coded labels (cyan for bullish breaks, red for bearish breaks)
- Small horizontal lines marking the exact breakout level
- Extended lines from pivot points showing key support/resistance levels
Settings
Pivot Strength - Number of candles on each side required to confirm a swing high/low (default: 5). Higher values identify more significant pivots but produce fewer signals.
Breakout Confirmation - Choose whether breakouts require a candle close beyond the level ("Close") or just a wick touch ("Wick").
Show BOS / Show ChoCh - Toggle visibility of Break of Structure and Change of Character signals independently.
Colors - Customize the colors for bullish (cyan) and bearish (red) signals.
Perfect for swing traders and market structure analysis.
Script de código abierto
Fiel al espíritu de TradingView, el creador de este script lo ha convertido en código abierto, para que los traders puedan revisar y verificar su funcionalidad. ¡Enhorabuena al autor! Aunque puede utilizarlo de forma gratuita, recuerde que la republicación del código está sujeta a nuestras Normas internas.
Exención de responsabilidad
La información y las publicaciones no constituyen, ni deben considerarse como asesoramiento o recomendaciones financieras, de inversión, de trading o de otro tipo proporcionadas o respaldadas por TradingView. Más información en Condiciones de uso.