Profit Accumulator Relative Volatility
This is a support indicator to the Main Indicator which has also been published.
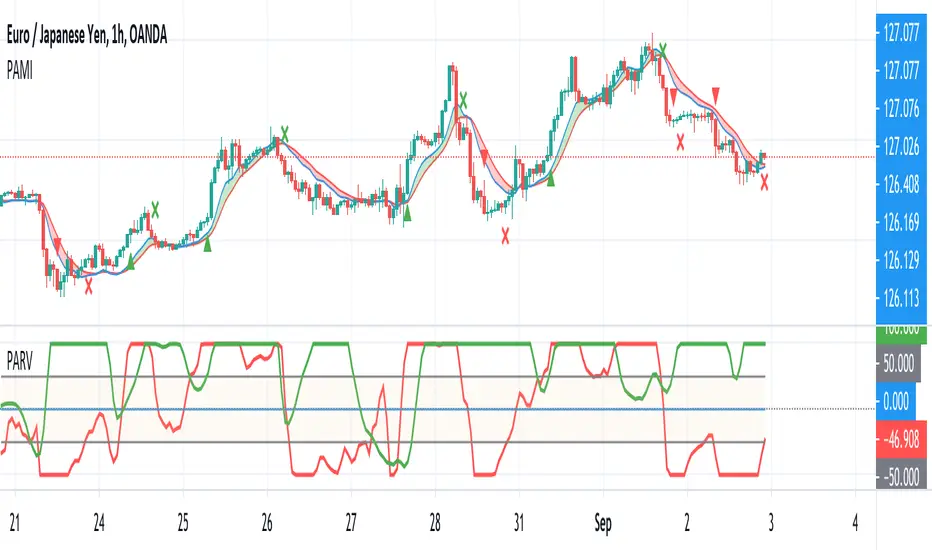
This indicator uses volatility to determine if the market is quiet, or trading sideways or if there is money in the market and the opportunity for a long or short signal. There is an adjustable bottom line (in this case 0.15) and anything near or below that would indicate that no trades should be taking place. Similarly, if the trend line is declining, this is another indication that any trades should not be taken.
The trend line as an adjustable maximum setting of 0.5 and an increasing trend line is indicative of volatility in the market and a long or short position should be considered. This indicator should be used with the other suite of indicators to provide confluence of the trade.
Whilst an actual alert function is not set for the indicator, the TradingView alert function can be used to trigger a message when the line crosses above 0.15.
I've been using this successfully on the one hour FX charts, but seems to work equally as well on higher or lower time frames (not less than 15min).
The other indicators which are part of the suite are shown on the website which is highlighted in my signature at the bottom of the page. Purchase of the main indicator gives access to the full suite of eight indicators. I use the other indicators to confirm the direction of the trade and to determine if I want to trade or not. I use it along with the 2min, 15min and 4hr timeframes to identify the best entry window and how long I'm likely to be in the trade.
Support can be provided via private message or in the comments below.
The links are provided below for access to the indicator.
The green line indicates the relative volatility. Anything above zero is an indication that the market is becoming more volatile and where trades should be considered. Ideal trades are where the value has dipped below zero and then breaks the zero horizontal.
The red line is relating to the % of the candle in relation to the Bollinger band width. The value of 100 would indicate a long trade should be considered and a value of -100 would indicate a short trade should be considered.
Script que requiere invitación
Solo los usuarios autorizados por el autor pueden acceder a este script. Tendrá que solicitar y obtener permiso para utilizarlo. Normalmente se concede previo pago. Para obtener más información, siga las instrucciones del autor o póngase en contacto directamente con Mikeo82.
TradingView NO recomienda pagar o utilizar un script a menos que confíe plenamente en su autor y entienda cómo funciona. También puede encontrar alternativas gratuitas de código abierto en nuestros scripts de la comunidad.
Instrucciones del autor
Exención de responsabilidad
Script que requiere invitación
Solo los usuarios autorizados por el autor pueden acceder a este script. Tendrá que solicitar y obtener permiso para utilizarlo. Normalmente se concede previo pago. Para obtener más información, siga las instrucciones del autor o póngase en contacto directamente con Mikeo82.
TradingView NO recomienda pagar o utilizar un script a menos que confíe plenamente en su autor y entienda cómo funciona. También puede encontrar alternativas gratuitas de código abierto en nuestros scripts de la comunidad.