OPEN-SOURCE SCRIPT
Actualizado Wavechart v2
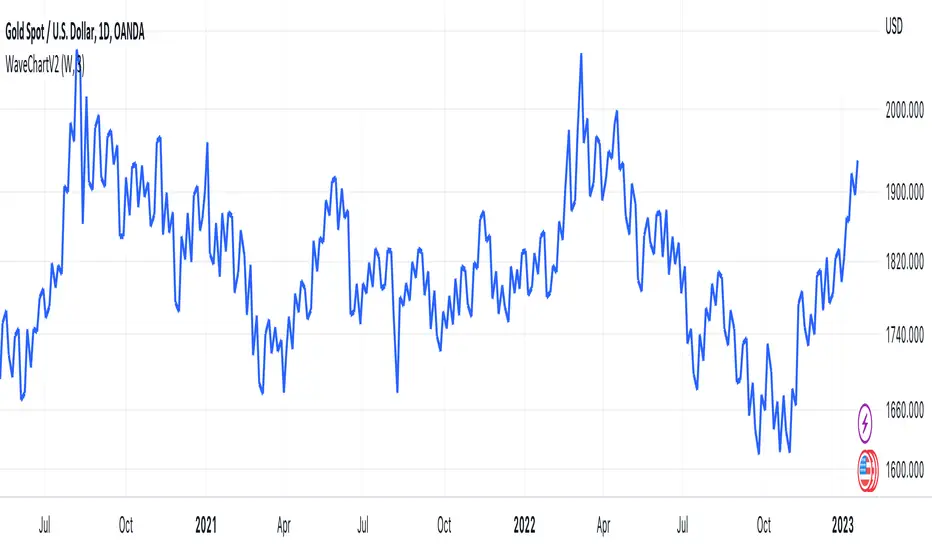
##Wave Chart v2##
For analyzing Neo-wave theory
Plot the market's highs and lows in real-time order.
Then connect the highs and lows
with a diagonal line. Next, the last plot of one day (or bar) is connected with a straight line to the
first plot of the next day (or bar).
For analyzing Neo-wave theory
Plot the market's highs and lows in real-time order.
Then connect the highs and lows
with a diagonal line. Next, the last plot of one day (or bar) is connected with a straight line to the
first plot of the next day (or bar).
Notas de prensa
Chang nameNotas de prensa
- Add line width input - Add Force plot on the last bar
Notas de prensa
Add Timeframe DayNotas de prensa
In some cases, it may be uncertain whether the high or low value should come first, as both values are derived from the same candlestick. We currently assume it is based on the closing price of the candlestick.
However, there is an option in settings to display an unsure line.
To avoid ambiguity, it is recommended to use multiple timeframes for analysis.
Notas de prensa
fix Force plot on the last barNotas de prensa
Add more TimeframeNotas de prensa
fix period divisionNotas de prensa
fix bug assume high low time based on closing price of the candlestickNotas de prensa
Add Timeframe 240,60,30 Notas de prensa
Add timeframe 2W and 2.5YNotas de prensa
fix 2.5yearScript de código abierto
Fiel al espíritu de TradingView, el creador de este script lo ha convertido en código abierto, para que los traders puedan revisar y verificar su funcionalidad. ¡Enhorabuena al autor! Aunque puede utilizarlo de forma gratuita, recuerde que la republicación del código está sujeta a nuestras Normas internas.
Exención de responsabilidad
La información y las publicaciones no constituyen, ni deben considerarse como asesoramiento o recomendaciones financieras, de inversión, de trading o de otro tipo proporcionadas o respaldadas por TradingView. Más información en Condiciones de uso.
Script de código abierto
Fiel al espíritu de TradingView, el creador de este script lo ha convertido en código abierto, para que los traders puedan revisar y verificar su funcionalidad. ¡Enhorabuena al autor! Aunque puede utilizarlo de forma gratuita, recuerde que la republicación del código está sujeta a nuestras Normas internas.
Exención de responsabilidad
La información y las publicaciones no constituyen, ni deben considerarse como asesoramiento o recomendaciones financieras, de inversión, de trading o de otro tipo proporcionadas o respaldadas por TradingView. Más información en Condiciones de uso.