OPEN-SOURCE SCRIPT
Actualizado WaveMacBoll
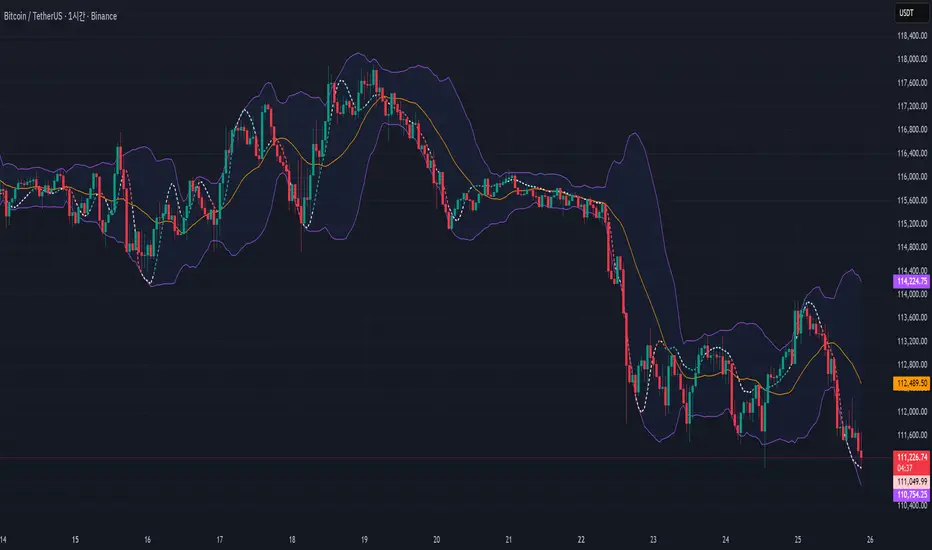
I wanted to see the two indicators in the candle chart, not in a separate window. And within the Bollinger band, it seemed to put it fine.
Important Note on Line Styles
Due to TradingView's multi-timeframe environment restrictions (timeframe = '', timeframe_gaps = true), I couldn't implement dotted or dashed line styles programmatically. The indicator uses solid lines by default.
If you prefer dotted/dashed lines for better visual distinction:
Add the indicator to your chart
Click on the indicator settings (gear icon)
Go to "Style" tab
Manually change line styles for each plot
Unfortunately, PineScript doesn't support line.new() or similar drawing functions in multi-timeframe mode, limiting our styling options to basic plot styles.
If you know a good solution for implementing dotted/dashed lines in multi-timeframe indicators without using drawing objects, please share it in the comments! I'd love to improve this aspect of the indicator
Notas de prensa
.Script de código abierto
Fiel al espíritu de TradingView, el creador de este script lo ha convertido en código abierto, para que los traders puedan revisar y verificar su funcionalidad. ¡Enhorabuena al autor! Aunque puede utilizarlo de forma gratuita, recuerde que la republicación del código está sujeta a nuestras Normas internas.
Exención de responsabilidad
La información y las publicaciones no constituyen, ni deben considerarse como asesoramiento o recomendaciones financieras, de inversión, de trading o de otro tipo proporcionadas o respaldadas por TradingView. Más información en Condiciones de uso.
Script de código abierto
Fiel al espíritu de TradingView, el creador de este script lo ha convertido en código abierto, para que los traders puedan revisar y verificar su funcionalidad. ¡Enhorabuena al autor! Aunque puede utilizarlo de forma gratuita, recuerde que la republicación del código está sujeta a nuestras Normas internas.
Exención de responsabilidad
La información y las publicaciones no constituyen, ni deben considerarse como asesoramiento o recomendaciones financieras, de inversión, de trading o de otro tipo proporcionadas o respaldadas por TradingView. Más información en Condiciones de uso.