OPEN-SOURCE SCRIPT
EMAs Personalizáveis (até 5)
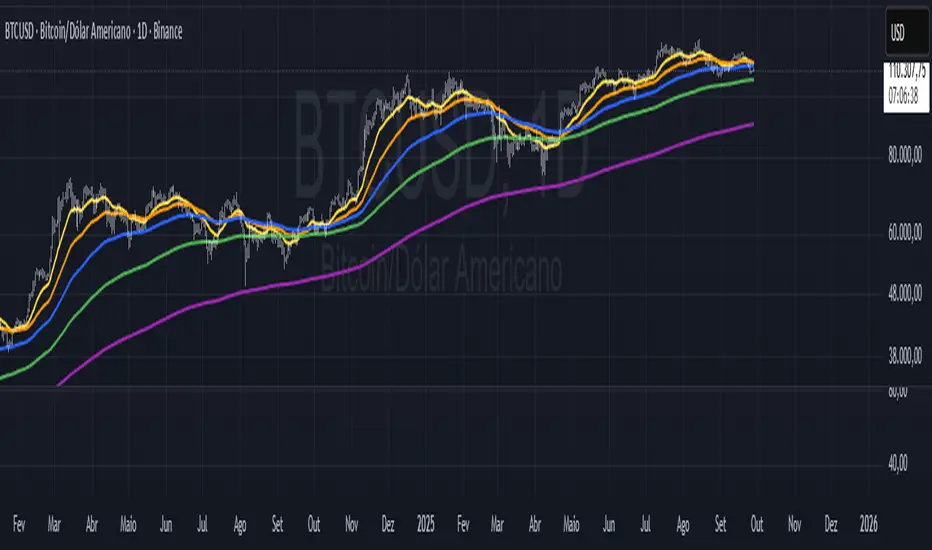
📘 Indicator Explanation – Customizable EMAs (up to 5)
This indicator was developed in Pine Script v6 to make it easier to visualize multiple Exponential Moving Averages (EMAs) on a single chart.
🔑 Main features:
Supports up to 5 different EMAs.
Ability to enable or disable each EMA individually.
Fully customizable period for each EMA.
Flexible color selection for better visual organization.
Adjustable line thickness to highlight the most relevant levels.
📌 How to use:
Open the indicator settings.
Select which EMAs you want to display (from 1 to 5).
Define the period (e.g., 20, 50, 100, 200, etc.).
Choose a color for each EMA.
Observe price behavior relative to the EMAs to identify:
Trends → price above long EMAs indicates bullish strength.
Reversals → EMA crossovers may signal a change in direction.
Dynamic support and resistance → EMAs often act as reaction zones for price.
💡 Practical example:
Short EMA (20) → shows short-term movement.
Mid-term EMA (50 or 100) → confirms trend direction.
Long EMA (200 or 500) → indicates the overall market trend.
👉 This indicator is flexible and can be used for scalping, swing trading, or position trading, depending on the chosen periods.
Script de código abierto
Fiel al espíritu de TradingView, el creador de este script lo ha convertido en código abierto, para que los traders puedan revisar y verificar su funcionalidad. ¡Enhorabuena al autor! Aunque puede utilizarlo de forma gratuita, recuerde que la republicación del código está sujeta a nuestras Normas internas.
Exención de responsabilidad
La información y las publicaciones no constituyen, ni deben considerarse como asesoramiento o recomendaciones financieras, de inversión, de trading o de otro tipo proporcionadas o respaldadas por TradingView. Más información en Condiciones de uso.