PROTECTED SOURCE SCRIPT
VOLATILITY BANDS BY ISHU
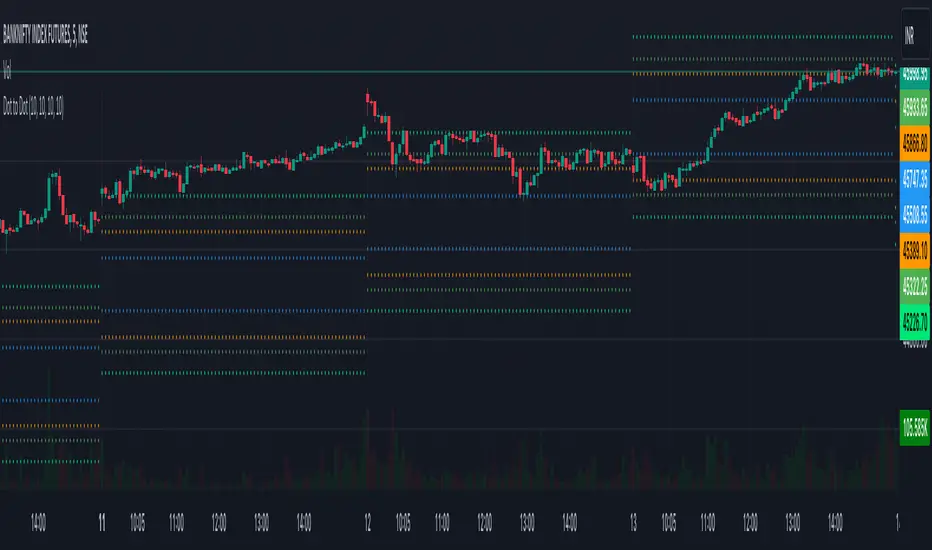
This is the simple trading system based on volatility where these bands are used as entry points and trailing stops . A brief explanation of the system is as below.
Because the volatility of a stock is its standard deviation, we can statistically establish “confidence Intervals” of the price moves. In statistics, a one standard deviation range means that there is a 68-
percent likelihood the stock price will stay within the range (a 67-percent confidence interval). The confidence value for different standard deviations are
1.00 - 68%
1.28 - 80%
1.50 - 88%
2.00 - 95%
So, we draw bands at various standard deviation levels like 0.25, 0.5, 1, 1.28, 1.65 and 2 from the previous day’s close. Entry is made once the price cross above a Band and the same band because the stop loss. When the price crosses above the next band the stop loss is shifted to this band value. This point can be also a “ADD ON” point. In the same way trading can be done on the down side as well.
The current formula uses the VIX values of the previous day which is available from NSE web site. The High Value of the VIX is used for the higher Bands and the Low value of the VIX is use for the lower Bands. This is Intraday Trading system only. The system is ideally suited for the Index as it is based on the VIX.
This system belongs solely to karthikmarar , all credits goes to Mr.karthik , i am feeling very grateful blessed and privileged at same time as i came across his huge sea of knowledge. Please give a visit on his page, follow him and show your support !🙏🏻
Script protegido
Este script se publica como código cerrado. Sin embargo, puede utilizarlo libremente y sin limitaciones: obtenga más información aquí.
Exención de responsabilidad
La información y las publicaciones que ofrecemos, no implican ni constituyen un asesoramiento financiero, ni de inversión, trading o cualquier otro tipo de consejo o recomendación emitida o respaldada por TradingView. Puede obtener información adicional en las Condiciones de uso.