Titan Radar | Oquant
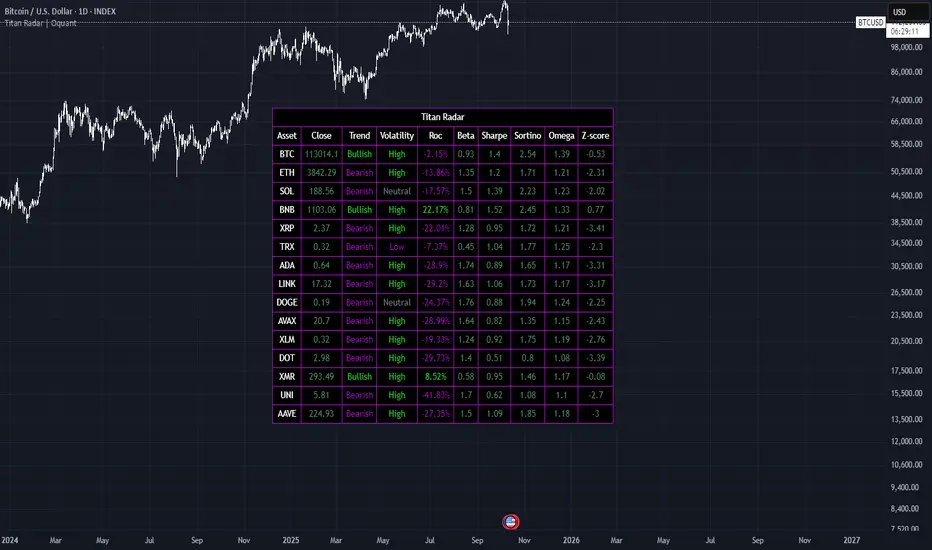
Titan Radar is a comprehensive multi-asset screener designed to provide traders with a view of key market dynamics across up to 15 user-selected assets. It aggregates essential metrics such as trend states, volatility levels, rate of change (ROC), beta, risk-adjusted performance ratios (Sharpe, Sortino, and Omega), and Z-scores into an table format(Remember past performance doesn’t guarantee future results). This tool helps identify potential opportunities by highlighting assets with bullish or bearish trends, high, low or neutral volatility, momentum shifts, and relative performance characteristics, all while emphasizing risk management through established financial metrics(Remember past performance doesn’t guarantee future results).
Key Components
The screener evaluates each asset across several dimensions:
Trend State: Determined by a consensus of multiple trend-detection methods to classify the asset as Bullish, Bearish, or Neutral.
Volatility State: Assesses volatility by using Z-score of standard deviation, categorizing it as High, Low, or Neutral.
Rate of Change (ROC): Measures percentage change over a specified period to gauge momentum.
Beta: Calculates the asset's volatility&correlation to a benchmark (e.g., total crypto market cap) for understanding systematic risk.
Sharpe Ratio: Evaluates risk-adjusted returns by comparing average returns to total volatility of returns, annualized for comparability.
Sortino Ratio: Like Sharpe, evaluates risk-adjusted returns by dividing average returns by volatility (annualized), but it focuses solely on downside risk by using the standard deviation of negative returns only.
Omega Ratio: Quantifies reward-to-risk by checking the total magnitude of positive returns compared to the total magnitude of negative returns(value above 1 means more positive than negative returns).
Z-Score: Normalizes the asset's price relative to its recent mean and standard deviation for spotting deviations.
Remember past performance doesn’t guarantee future results.
How It Works
The script fetches closing prices for the selected assets and applies a blend of smoothing techniques, deviation bands, normalization, and statistical measures to derive each metric. For trends, it averages signals(1 for bullish, -1 for bearish) from various filters like adaptive moving averages, percentile-based bands, and Z-score thresholds to produce a robust directional bias. Volatility is derived from standard deviation Z-score to detect expansions or contractions. Performance ratios use return series to compute annualized values, ensuring they account for timeframes without assuming constant compounding. The results are color-coded and displayed in a table for quick scanning, allowing traders to compare assets at a glance without manual calculations.
Recommended Use Cases
This tool is ideal for cryptocurrency traders managing diversified portfolios, such as swing traders seeking to rotate into high-momentum, low-risk assets during market cycles. It's particularly useful for those monitoring altcoins relative to majors like BTC or ETH, identifying volatility levels(high, low, neutral), or screening for high/low beta positions. Swing traders can use it to find positions and benefit from the risk metrics to evaluate position health(Remember past performance doesn’t guarantee future results).
It's best suited for users familiar with basic financial metrics who want an efficient way to screen multiple assets simultaneously.
Settings and Default Settings
Assets (Asset 1 to Asset 15): Select symbols like BTCUSD, ETHUSD, etc. (Defaults: BTCUSD, ETHUSD, SOLUSD, BNBUSD, XRPUSD, TRXUSD, ADAUSD, LINKUSD, DOGEUSD, AVAXUSD, XLMUSD, DOTUSD, XMRUSD, UNIUSD, AAVEUSD).
SD Length (Volatility): Period for standard deviation calculation (Default: 20).
Volatility Z-Score Period: Length for Z-score of volatility (Default: 40).
Upper/Lower Threshold of SD Z-Score: Bounds for high/low volatility classification (Defaults: 0.5 / -0.5).
ROC Length: Period for rate of change (Default: 30).
Beta Benchmark: Symbol for beta calculation (Default: CRYPTOCAP:TOTAL).
Beta Length: Period for beta computation (Default: 500).
Z-Score Period: General Z-score length (Default: 40).
Trend Settings: Includes ALMA length/offset/sigma (Defaults: 35/0.75/6), SD length/multiplier (Defaults: 25/1.4), EMA length/normalization length/thresholds (Defaults: 30/40/0.7/0.3), DEMA length/Z-score period/thresholds (Defaults: 25/30/0.4/-0.4), LSMA length/smoothing/IQR length/multiplier (Defaults: 35/25/25/1.4), RMA/MAD lengths/multiplier (Defaults: 15/20/1).
Trend Thresholds: Bullish/Bearish score thresholds (Defaults: 0.2/0).
Conclusion
Titan Radar streamlines multi-asset analysis by combining trend, momentum, volatility, and risk metrics into one dashboard, saving time. Its focus on consensus-based signals and established risk measures makes it a practical addition for traders aiming to make informed decisions in markets like crypto(remember past performance doesn’t guarantee future results).
⚠️ Disclaimer: This indicator is intended for educational and informational purposes only. Trading/investing involves risk, and past performance does not guarantee future results. Always test and evaluate indicators/strategies before applying them in live markets. Use at your own risk.
Script que requiere invitación
Solo los usuarios autorizados por el autor pueden acceder a este script. Tendrá que solicitar y obtener permiso para utilizarlo. Normalmente se concede previo pago. Para obtener más información, siga las instrucciones del autor o póngase en contacto directamente con oquant.
TradingView NO recomienda pagar o utilizar un script a menos que confíe plenamente en su autor y entienda cómo funciona. También puede encontrar alternativas gratuitas de código abierto en nuestros scripts de la comunidad.
Instrucciones del autor
oquantsystems.com
Exención de responsabilidad
Script que requiere invitación
Solo los usuarios autorizados por el autor pueden acceder a este script. Tendrá que solicitar y obtener permiso para utilizarlo. Normalmente se concede previo pago. Para obtener más información, siga las instrucciones del autor o póngase en contacto directamente con oquant.
TradingView NO recomienda pagar o utilizar un script a menos que confíe plenamente en su autor y entienda cómo funciona. También puede encontrar alternativas gratuitas de código abierto en nuestros scripts de la comunidad.
Instrucciones del autor
oquantsystems.com