OPEN-SOURCE SCRIPT
Actualizado RSI Divergency and Golden Ratio

How to calculate:
Positive mismatch finds the lowest trough within the distance you choose. It then compares it to the current closing value.
If the past low is above the current closing level, it means that the bottoms of the price are descending.
The RSI level at the furthest bottom of the price is detected. And the current RSI level is detected. If the current RSI level is higher than the previous RSI level, there is a positive divergence.
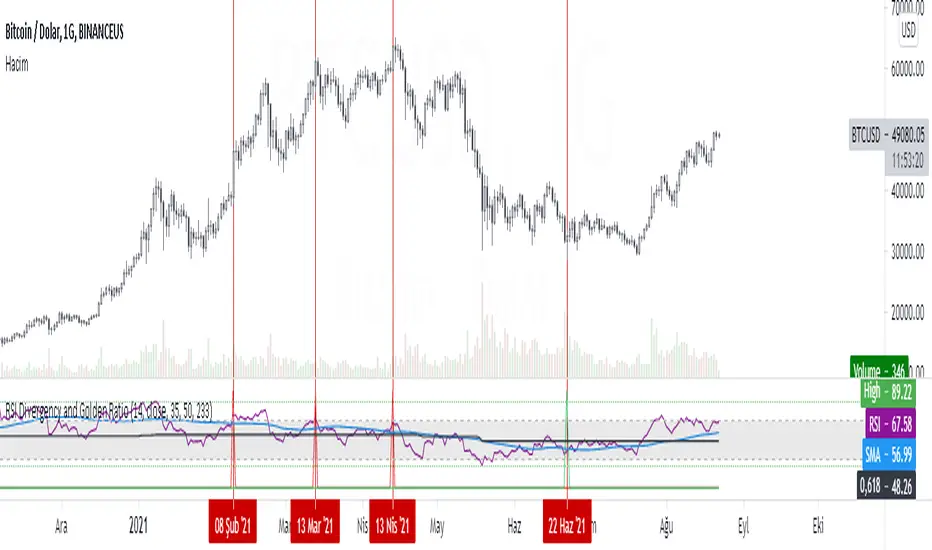
When a positive divergence occurs, a green pole forms above the RSI indicator on the chart.
Negative finds the highest peak level within the distance you choose. It then compares it to the current closing value.
If the past high is below the current close, it means that the highs of the price are rising.
The RSI level at the furthest high of the price is detected. And the current RSI level is detected. If the current RSI level is lower than the previous RSI level, there is negative divergence.
When a negative divergence occurs, a red pole forms above the RSI indicator on the chart.

As can be seen in the image, the points marked with red are the regions where incompatibility occurs. At the same time, the signals that occur when the RSI cuts its own moving average and the signals that occur when the RSI cuts its own golden ratio are also very strong signals.
Waiting for your ideas and comments. I am open to criticism. We can improve.
Positive mismatch finds the lowest trough within the distance you choose. It then compares it to the current closing value.
If the past low is above the current closing level, it means that the bottoms of the price are descending.
The RSI level at the furthest bottom of the price is detected. And the current RSI level is detected. If the current RSI level is higher than the previous RSI level, there is a positive divergence.
When a positive divergence occurs, a green pole forms above the RSI indicator on the chart.
Negative finds the highest peak level within the distance you choose. It then compares it to the current closing value.
If the past high is below the current close, it means that the highs of the price are rising.
The RSI level at the furthest high of the price is detected. And the current RSI level is detected. If the current RSI level is lower than the previous RSI level, there is negative divergence.
When a negative divergence occurs, a red pole forms above the RSI indicator on the chart.
As can be seen in the image, the points marked with red are the regions where incompatibility occurs. At the same time, the signals that occur when the RSI cuts its own moving average and the signals that occur when the RSI cuts its own golden ratio are also very strong signals.
Waiting for your ideas and comments. I am open to criticism. We can improve.
Notas de prensa
Formule repairedNotas de prensa
Add titleNotas de prensa
Formule fixedScript de código abierto
Fiel al espíritu de TradingView, el creador de este script lo ha convertido en código abierto, para que los traders puedan revisar y verificar su funcionalidad. ¡Enhorabuena al autor! Aunque puede utilizarlo de forma gratuita, recuerde que la republicación del código está sujeta a nuestras Normas internas.
AlgoTrade sevdası.
Exención de responsabilidad
La información y las publicaciones no constituyen, ni deben considerarse como asesoramiento o recomendaciones financieras, de inversión, de trading o de otro tipo proporcionadas o respaldadas por TradingView. Más información en Condiciones de uso.
Script de código abierto
Fiel al espíritu de TradingView, el creador de este script lo ha convertido en código abierto, para que los traders puedan revisar y verificar su funcionalidad. ¡Enhorabuena al autor! Aunque puede utilizarlo de forma gratuita, recuerde que la republicación del código está sujeta a nuestras Normas internas.
AlgoTrade sevdası.
Exención de responsabilidad
La información y las publicaciones no constituyen, ni deben considerarse como asesoramiento o recomendaciones financieras, de inversión, de trading o de otro tipo proporcionadas o respaldadas por TradingView. Más información en Condiciones de uso.