OPEN-SOURCE SCRIPT
High Volume Engulfing Candle_bullHorn
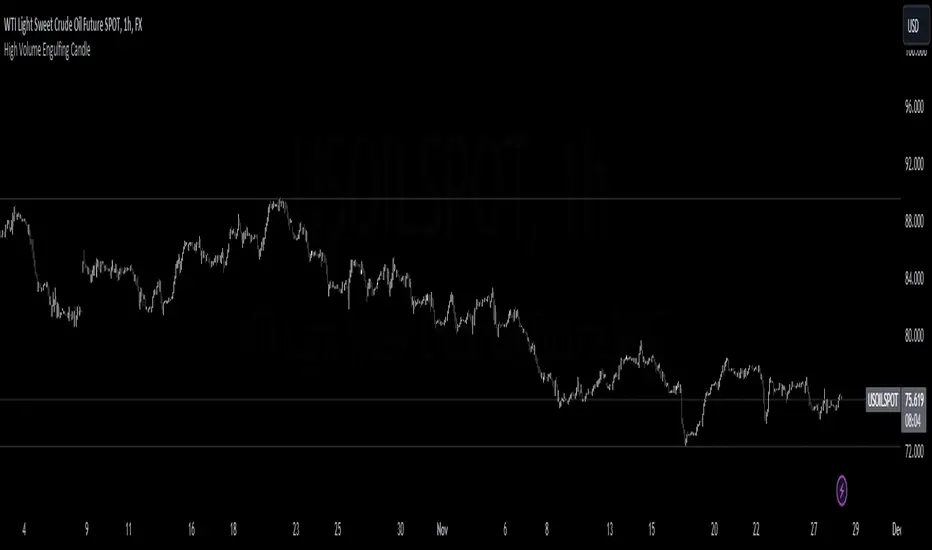
The "High Volume Engulfing Candle" indicator is a technical analysis tool used in trading to identify specific candlestick patterns that suggest potential reversals or significant price movements in a financial instrument. It focuses on two key criteria: the engulfing candlestick pattern and high trading volume. Here's a brief description of the indicator:
Engulfing Candlestick Pattern: The indicator looks for bullish and bearish engulfing candlestick patterns.
Bullish Engulfing: This pattern occurs when the current candlestick completely engulfs the previous one. In other words, the current candlestick's body (the open and close prices) is larger than the previous candlestick's body, and it closes higher than the previous candle's close. It suggests a potential bullish reversal.
Bearish Engulfing: This pattern occurs when the current candlestick's body completely engulfs the previous one, but in the opposite direction. The current candlestick's body is larger than the previous candlestick's body, and it closes lower than the previous candle's close. It suggests a potential bearish reversal.
High Volume Confirmation: In addition to the engulfing pattern, the indicator considers trading volume. It looks for instances where the volume accompanying the engulfing candle is significantly higher than a moving average of the volume. This indicates strong market participation and validates the importance of the engulfing candle pattern.
Arrows on the Chart: When a high volume engulfing candle pattern is detected, the indicator plots arrows on the price chart. A green triangle pointing up is used for bullish engulfing patterns, while a red triangle pointing down is used for bearish engulfing patterns. These arrows help traders quickly identify potential reversal points.
Overall, the "High Volume Engulfing Candle" indicator combines the visual recognition of candlestick patterns with volume analysis to provide traders with potential signals for trend reversals or significant price moves in the market. Traders can use these signals as part of their technical analysis and trading strategies.
Script de código abierto
Fiel al espíritu de TradingView, el creador de este script lo ha convertido en código abierto, para que los traders puedan revisar y verificar su funcionalidad. ¡Enhorabuena al autor! Aunque puede utilizarlo de forma gratuita, recuerde que la republicación del código está sujeta a nuestras Normas internas.
Exención de responsabilidad
La información y las publicaciones no constituyen, ni deben considerarse como asesoramiento o recomendaciones financieras, de inversión, de trading o de otro tipo proporcionadas o respaldadas por TradingView. Más información en Condiciones de uso.