OPEN-SOURCE SCRIPT
Quadratic MA
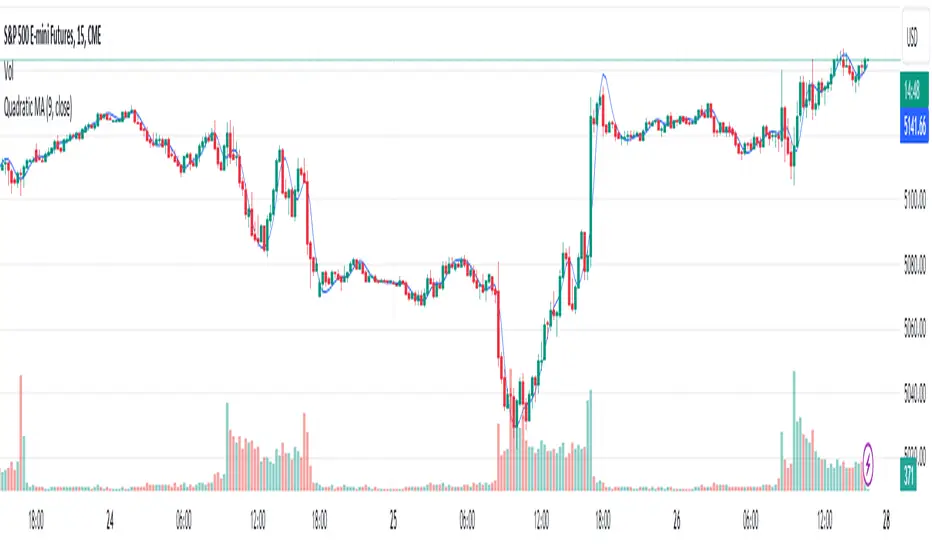
The Quadratic Moving Average (QMA) is an advanced smoothing indicator that provides a smoother and more responsive moving average by applying the Weighted Moving Average (WMA) methodology in a unique, multi-layered approach. This indicator is especially useful for identifying trends in highly volatile markets where data points vary significantly.
Calculation:
The QMA is calculated by first determining a basic WMA over half the specified period and then modifying it by subtracting the WMA over the full period, effectively emphasizing recent price changes. This result is then re-smoothed using another WMA function applied over the square root of the specified length, providing a quadratic enhancement to the typical WMA.
Usage:
The QMA can be particularly effective in trend-following strategies. When the price moves above the QMA line, it may indicate a bullish trend, suggesting a potential buy signal. Conversely, if the price falls below the QMA line, it may signal a bearish trend, indicating a potential sell signal.
Settings:
Length: Controls the sensitivity of the QMA to price changes. A shorter length will make the QMA more responsive to price changes, while a longer length will smooth out the moving average further, potentially reducing the number of signals and noise.
Tips:
Combine the QMA with other forms of analysis, such as volume indicators or momentum oscillators, to confirm trends and refine trading signals.
Adjust the length parameter according to your trading style and the asset's volatility to optimize performance.
Script de código abierto
Fiel al espíritu de TradingView, el creador de este script lo ha convertido en código abierto, para que los traders puedan revisar y verificar su funcionalidad. ¡Enhorabuena al autor! Aunque puede utilizarlo de forma gratuita, recuerde que la republicación del código está sujeta a nuestras Normas internas.
Exención de responsabilidad
La información y las publicaciones no constituyen, ni deben considerarse como asesoramiento o recomendaciones financieras, de inversión, de trading o de otro tipo proporcionadas o respaldadas por TradingView. Más información en Condiciones de uso.