OPEN-SOURCE SCRIPT
Actualizado Scaled Historical ATR [SS]
Hello again everyone,
This is the Scaled ATR Range indicator. This was done in response to an article/analysis I posted regarding the expected high and range on SPX. I would encourage you to read it here:

Essentially, I took SPX data, scaled it to correct for inflation, then calculated the ATR for Bullish years to get our average range to expect and our close range to expected.
I accomplished this analysis using Excel; however, I figured Pinescript would handle this type of task more elegantly, and I was correct!
This indicator is the result.
What it does:
This indicator permits the analyst to select a historic period in time. The indicator will then scale the period into returns and convert the range to a corrected range based on the current position of the ticker. How it does this is by converting the returns of the historic period selected, then multiplying the returns by the current period open, to ensure that the range amounts are corrected for inflation and natural growth of a ticker.
I say analyst because this indicator is intended to be used by both professional and recreational analysts, to give them an easy way to:
a) Scale historic data and correct it based on the current rate; and
b) Offer insight into a ticker’s ATR and behaviour during bullish and bearish periods.
Prior to this indicator, the only way to do this would be manually or the use of statistical software.
How to use?
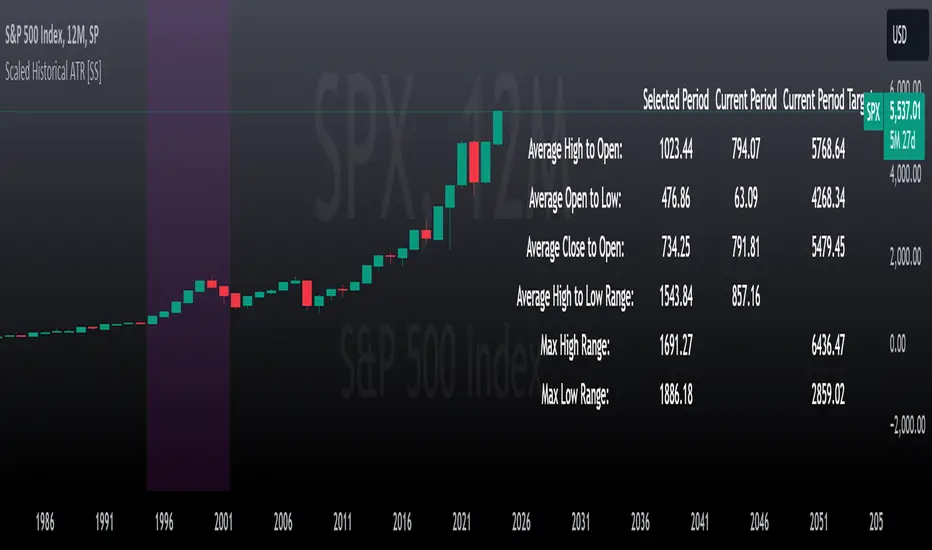
The indicator’s use is quite simple. Once launched, the indicator will ask the user to input a timeframe period that the user is interested in assessing. In the main chart above, I chose SPX between 1995 and 2001.
The user can further filter down the data using the settings menu. In the settings menu, there is an option to filter by “All”, “Bullish Periods” or “Bearish Periods”.
Filtering by “All”
Filtering by “All” will include all candles selected within the timeframe. This includes both bearish and bullish candles. It will give you the averaged out range for the entire period of time, including both bearish and bullish instances.
Filtering by “Bullish”
Filtering by “Bullish” will omit any red candles from the analysis. It will only return the ATR ranges for green, bullish candles.
Filtering by “Bearish”
Inverse to filtering by Bullish, if you filter by Bearish, it will only include the red, bearish candles in the analysis.

My suggestion? If you are trying to determine t he likely outcome of a bullish year, filter by Bullish instances. If you want the likely outcome of a bearish year, filter by Bearish.
Other features of the Indicator:
The indicator will display the current period statistics. In the main chart above, you can see that the current ranges for this year are displayed. This allows you to do a side by side comparison of the current period vs. the historic period you are looking at. This can alert you to further upside, further downside and the anticipated close range. It can also alert you to whether or not we are following a similar trajectory as the historical periods you are looking at.
As well, the indicator will list target prices for the current period based on the historical periods you are looking at. This helps to put things into perspective.
Concluding Remarks
And that is the indicator in a nutshell! I encourage you to read the article I linked above to see how you may use it in an analysis. This would be the best example of a real world application of this indicator!
Otherwise, I hope you enjoy and, as always, safe trades!
This is the Scaled ATR Range indicator. This was done in response to an article/analysis I posted regarding the expected high and range on SPX. I would encourage you to read it here:
Essentially, I took SPX data, scaled it to correct for inflation, then calculated the ATR for Bullish years to get our average range to expect and our close range to expected.
I accomplished this analysis using Excel; however, I figured Pinescript would handle this type of task more elegantly, and I was correct!
This indicator is the result.
What it does:
This indicator permits the analyst to select a historic period in time. The indicator will then scale the period into returns and convert the range to a corrected range based on the current position of the ticker. How it does this is by converting the returns of the historic period selected, then multiplying the returns by the current period open, to ensure that the range amounts are corrected for inflation and natural growth of a ticker.
I say analyst because this indicator is intended to be used by both professional and recreational analysts, to give them an easy way to:
a) Scale historic data and correct it based on the current rate; and
b) Offer insight into a ticker’s ATR and behaviour during bullish and bearish periods.
Prior to this indicator, the only way to do this would be manually or the use of statistical software.
How to use?
The indicator’s use is quite simple. Once launched, the indicator will ask the user to input a timeframe period that the user is interested in assessing. In the main chart above, I chose SPX between 1995 and 2001.
The user can further filter down the data using the settings menu. In the settings menu, there is an option to filter by “All”, “Bullish Periods” or “Bearish Periods”.
Filtering by “All”
Filtering by “All” will include all candles selected within the timeframe. This includes both bearish and bullish candles. It will give you the averaged out range for the entire period of time, including both bearish and bullish instances.
Filtering by “Bullish”
Filtering by “Bullish” will omit any red candles from the analysis. It will only return the ATR ranges for green, bullish candles.
Filtering by “Bearish”
Inverse to filtering by Bullish, if you filter by Bearish, it will only include the red, bearish candles in the analysis.
My suggestion? If you are trying to determine t he likely outcome of a bullish year, filter by Bullish instances. If you want the likely outcome of a bearish year, filter by Bearish.
Other features of the Indicator:
The indicator will display the current period statistics. In the main chart above, you can see that the current ranges for this year are displayed. This allows you to do a side by side comparison of the current period vs. the historic period you are looking at. This can alert you to further upside, further downside and the anticipated close range. It can also alert you to whether or not we are following a similar trajectory as the historical periods you are looking at.
As well, the indicator will list target prices for the current period based on the historical periods you are looking at. This helps to put things into perspective.
Concluding Remarks
And that is the indicator in a nutshell! I encourage you to read the article I linked above to see how you may use it in an analysis. This would be the best example of a real world application of this indicator!
Otherwise, I hope you enjoy and, as always, safe trades!
Notas de prensa
Added Max variables to see the max high range and max low range as well as the associated theoretical target price. Script de código abierto
Fiel al espíritu de TradingView, el creador de este script lo ha convertido en código abierto, para que los traders puedan revisar y verificar su funcionalidad. ¡Enhorabuena al autor! Aunque puede utilizarlo de forma gratuita, recuerde que la republicación del código está sujeta a nuestras Normas internas.
Get:
- Live Updates,
- Discord access,
- Access to my Proprietary Merlin Software,
- Access to premium indicators,
patreon.com/steversteves
Now on X!
- Live Updates,
- Discord access,
- Access to my Proprietary Merlin Software,
- Access to premium indicators,
patreon.com/steversteves
Now on X!
Exención de responsabilidad
La información y las publicaciones no constituyen, ni deben considerarse como asesoramiento o recomendaciones financieras, de inversión, de trading o de otro tipo proporcionadas o respaldadas por TradingView. Más información en Condiciones de uso.
Script de código abierto
Fiel al espíritu de TradingView, el creador de este script lo ha convertido en código abierto, para que los traders puedan revisar y verificar su funcionalidad. ¡Enhorabuena al autor! Aunque puede utilizarlo de forma gratuita, recuerde que la republicación del código está sujeta a nuestras Normas internas.
Get:
- Live Updates,
- Discord access,
- Access to my Proprietary Merlin Software,
- Access to premium indicators,
patreon.com/steversteves
Now on X!
- Live Updates,
- Discord access,
- Access to my Proprietary Merlin Software,
- Access to premium indicators,
patreon.com/steversteves
Now on X!
Exención de responsabilidad
La información y las publicaciones no constituyen, ni deben considerarse como asesoramiento o recomendaciones financieras, de inversión, de trading o de otro tipo proporcionadas o respaldadas por TradingView. Más información en Condiciones de uso.