PROTECTED SOURCE SCRIPT
[Max] Volume Entropy Divergence Heatmap
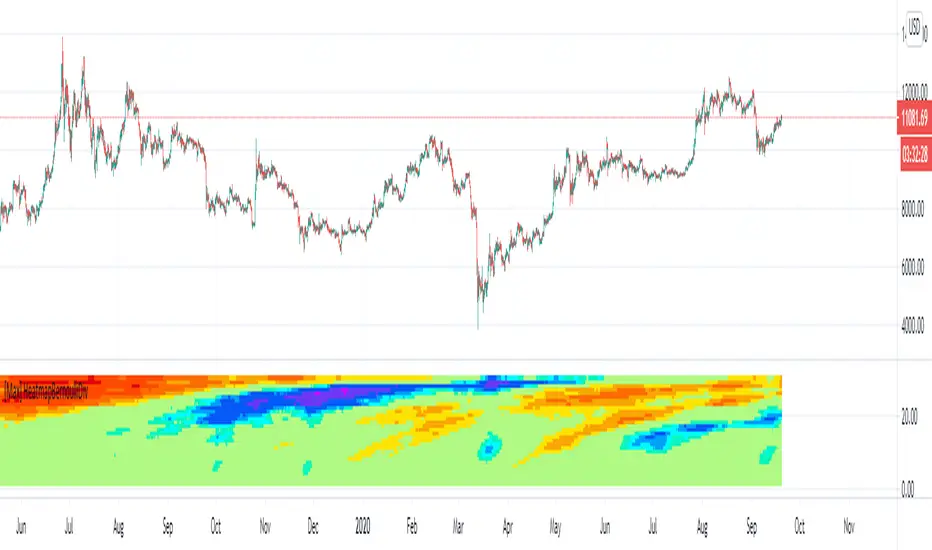
A divergence between volume and price indicator, based on custom filter function.
Each lines represent a length on wich the divergence is calculated. It goes to 60 len a the base to 2000 at the high. ( You have to decrease the timeframe if your looking on a new chart).
Colors represent a level of the oscillator who is calculated for each lengths.
What can you find, reversals, confirmation of continuation, divergences between volume and price,.. (if you find other usages I will be happy to hear it and share the code).
I recommand to be attentive to lower timeframes and confirm with higher ones and be attentive between different kind of clouds there is.
You are in charge to figure out how to use it, if you have some doubts on something you can DM me but I will not teach my way to use it.
It provide for me nice transformations, nice enough to share this indicator in private.
Big thanks to @midtownsk8rguy for the heatmap color function.
Have a nice daytrading all !
Script protegido
Este script se publica como código cerrado. No obstante, puede utilizarlo libremente y sin ninguna limitación. Obtenga más información aquí.
Exención de responsabilidad
La información y las publicaciones no constituyen, ni deben considerarse como asesoramiento o recomendaciones financieras, de inversión, de trading o de otro tipo proporcionadas o respaldadas por TradingView. Más información en Condiciones de uso.