OPEN-SOURCE SCRIPT
Opposite Delta Candle Highlighter with EMAs & Delta Boxes
**Description:**
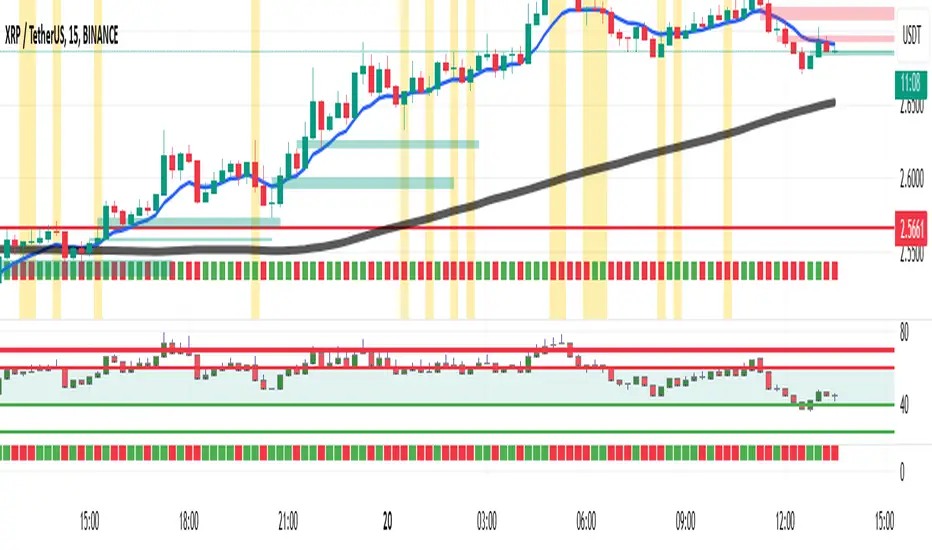
This indicator is designed to enhance market analysis by highlighting **candles with opposite-colored delta**, plotting **Exponential Moving Averages (EMAs)**, and displaying **delta volume as small boxes below the chart**.
🔹 **Key Features:**
✅ **Opposite Delta Candle Highlighting** – Candles where delta volume contradicts the price direction are highlighted with a **yellow background** and a **blue triangle** above the bar.
✅ **Three Exponential Moving Averages (EMAs)** – Includes **EMA (9, 21, 50)** to help identify trends and dynamic support/resistance levels.
✅ **Delta Volume Display** – Instead of large volume columns, delta is plotted as **small square boxes below the chart**, ensuring clear visibility without overlapping price candles.
✅ **Optimized for Lower Timeframes** – The indicator **automatically selects an appropriate lower timeframe** for more precise delta calculations.
🔹 **How It Works:**
- **Green Candle + Red Delta** → Opposite delta signal (Bearish Sign).
- **Red Candle + Green Delta** → Opposite delta signal (Bullish Sign).
- **Delta bars below the chart** indicate the strength of buying/selling pressure.
- **EMAs help identify the market trend** and potential trade entry zones.
🔹 **Use Cases:**
✔ **Scalping & Day Trading** – Identify potential reversals and trend continuation setups.
✔ **Volume Analysis** – Understand market participation and possible absorption.
✔ **Trend Confirmation** – Use EMAs to confirm trend direction alongside delta volume.
📌 *Best used with lower timeframes (1m, 5m, 15m) for detailed volume analysis.*
🚀 **Enhance your trading with real-time delta insights and price action analysis!**
Script de código abierto
Fiel al espíritu de TradingView, el creador de este script lo ha convertido en código abierto, para que los traders puedan revisar y verificar su funcionalidad. ¡Enhorabuena al autor! Aunque puede utilizarlo de forma gratuita, recuerde que la republicación del código está sujeta a nuestras Normas internas.
Exención de responsabilidad
La información y las publicaciones no constituyen, ni deben considerarse como asesoramiento o recomendaciones financieras, de inversión, de trading o de otro tipo proporcionadas o respaldadas por TradingView. Más información en Condiciones de uso.