OPEN-SOURCE SCRIPT
CakeProfits-SMA+EMA G
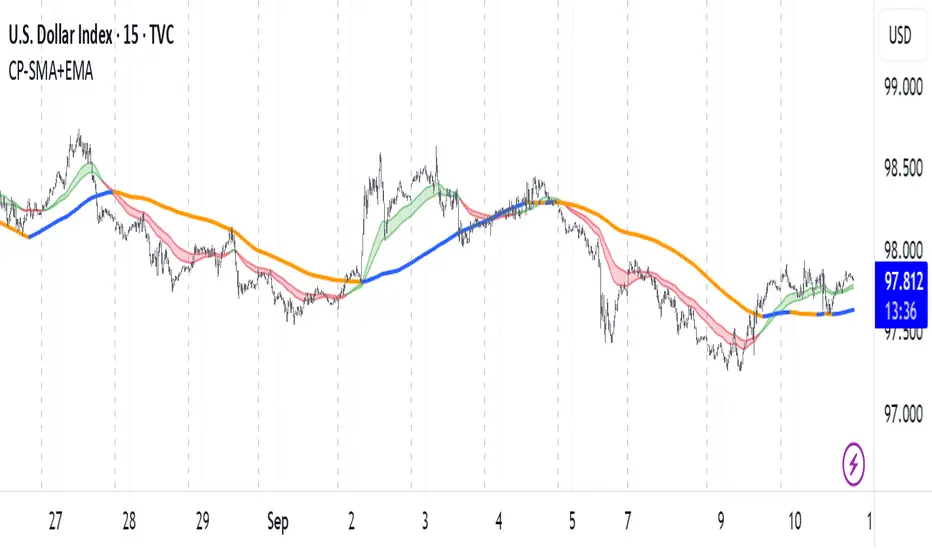
This indicator plots a dynamic color coded MA ribbon that visually highlights the relationship between a Simple Moving Average (SMA) and an Exponential Moving Average (EMA). The ribbon changes color based on bullish or bearish crossovers:
Bullish – EMA crosses above the SMA, indicating upward momentum.
Bearish – EMA crosses below the SMA, signaling potential downward pressure.
The SMA smooths out long-term price trends, while the EMA responds faster to recent price action. Together, they help traders identify shifts in market direction and momentum strength. The ribbon provides a clear, at-a-glance view of trend changes and can be used on any timeframe or market.
There is also the option to display a 200 SMA that is also color coded.
Common Uses:
Confirming trend direction.
Identifying early entry/exit points.
Filtering trades for trend-following strategies.
Script de código abierto
Siguiendo fielmente el espíritu de TradingView, el creador de este script lo ha publicado en código abierto, permitiendo que otros traders puedan revisar y verificar su funcionalidad. ¡Enhorabuena al autor! Puede utilizarlo de forma gratuita, pero tenga en cuenta que la publicación de este código está sujeta a nuestras Normas internas.
Exención de responsabilidad
La información y las publicaciones que ofrecemos, no implican ni constituyen un asesoramiento financiero, ni de inversión, trading o cualquier otro tipo de consejo o recomendación emitida o respaldada por TradingView. Puede obtener información adicional en las Condiciones de uso.