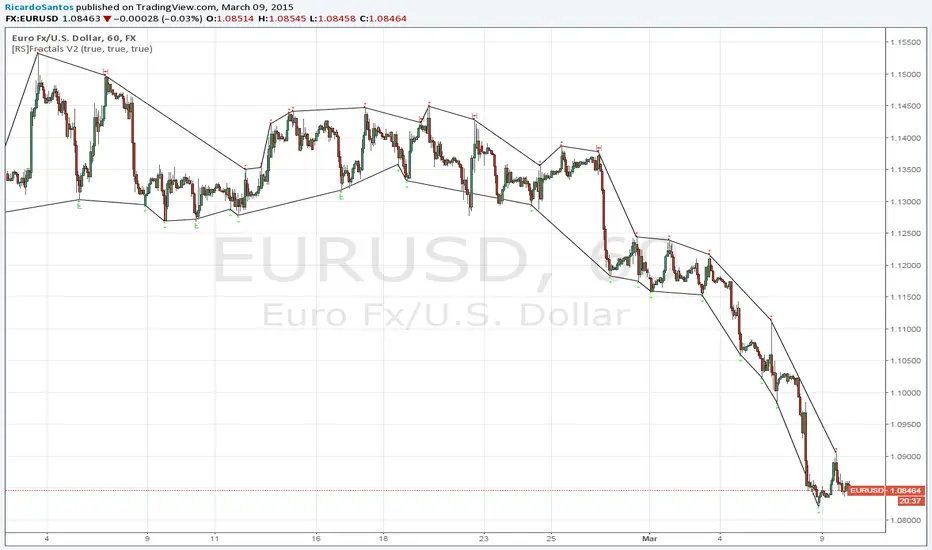
added channel option.
study(title="[RS]Fractals V2", overlay=true) length = 24 // ||--- V1: Added filtering option filterFractals = input(true) ftop = high[2] > high[3] and high[2] > high[4] and high[2] > high[1] and high[2] > high[0] fbot = low[2] < low[3] and low[2] < low[4] and low[2] < low[1] and low[1] < low[0] topf = ftop ? high[2] >= highest(high, length) ? true : false : false botf = fbot ? low[2] <= lowest(low, length) ? true : false : false filteredtopf = filterFractals ? topf : ftop filteredbotf = filterFractals ? botf : fbot plotshape(filteredtopf, style=shape.triangledown, location=location.abovebar, color=red, text="•", offset=-2) plotshape(filteredbotf, style=shape.triangleup, location=location.belowbar, color=lime, text="•", offset=-2) // ||--- V1 : Added Swing High/Low Option ShowSwingsHL = input(true) highswings = filteredtopf == false ? na : valuewhen(filteredtopf == true, high[2], 2) < valuewhen(filteredtopf == true, high[2], 1) and valuewhen(filteredtopf == true, high[2], 1) > valuewhen(filteredtopf == true, high[2], 0) lowswings = filteredbotf == false ? na : valuewhen(filteredbotf == true, low[2], 2) > valuewhen(filteredbotf == true, low[2], 1) and valuewhen(filteredbotf == true, low[2], 1) < valuewhen(filteredbotf == true, low[2], 0) //--------------------------------------------------------------------------------------------------------- // ||--- Offset calculation: // ||--- unable to use, plots cant use series for offset value... //hsoffset = n-valuewhen(ftop == true, n[2], 1) //lsoffset = n-valuewhen(fbot == true, n[2], 1) //--------------------------------------------------------------------------------------------------------- plotshape(ShowSwingsHL ? highswings : na, style=shape.triangledown, location=location.abovebar, color=maroon, text="H", offset=-2) plotshape(ShowSwingsHL ? lowswings : na, style=shape.triangleup, location=location.belowbar, color=green, text="L", offset=-2) // ||--- V2 : Plot Lines based on the fractals. showchannel = input(true) plot(showchannel ? (filteredtopf ? high[2] : na) : na, color=black, offset=-2) plot(showchannel ? (filteredbotf ? low[2] : na) : na, color=black, offset=-2) //--------------------------------------------------------------------------------------------------------- // ||--- HLswings channel: unable to offset values //plot(showchannel ? (highswings ? high[2] : na) : na, color=black, offset=-2) //plot(showchannel ? (lowswings ? low[2] : na) : na, color=black, offset=-2) //----------------------------------------------------------------------------------------------------------