PROTECTED SOURCE SCRIPT
PpSignal Renko
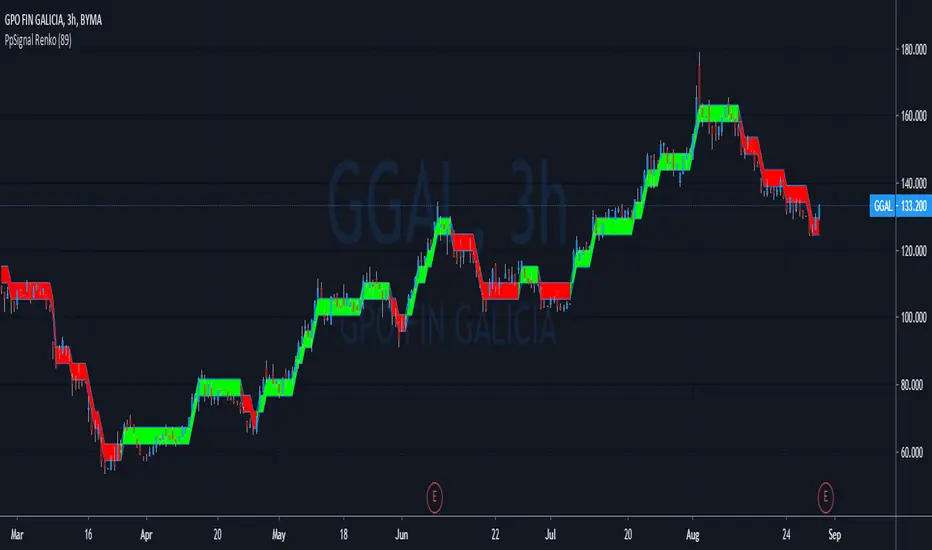
A renko chart is a type of financial chart of Japanese origin used in technical analysis that measures and plots price changes. A renko chart consists of bricks, which proponents say more clearly show market trends and increase the signal-to-noise ratio compared to typical candlestick charts
PpSignal Renko emulator you can see the Renko chart and the candle in the same time.
Work with atr Average true range.
Buy when the Renko is lime end sell when the Renko is red.
Be careful the Renko chart changes color when the close Renko price is higher than the open Renko so it can repaint up to the close price of the current candle
Script protegido
Este script se publica como código cerrado. No obstante, puede utilizarlo libremente y sin ninguna limitación. Obtenga más información aquí.
Exención de responsabilidad
La información y las publicaciones no constituyen, ni deben considerarse como asesoramiento o recomendaciones financieras, de inversión, de trading o de otro tipo proporcionadas o respaldadas por TradingView. Más información en Condiciones de uso.