PROTECTED SOURCE SCRIPT
TTHLD (Higher High / Lower Low Detector)

Overview:
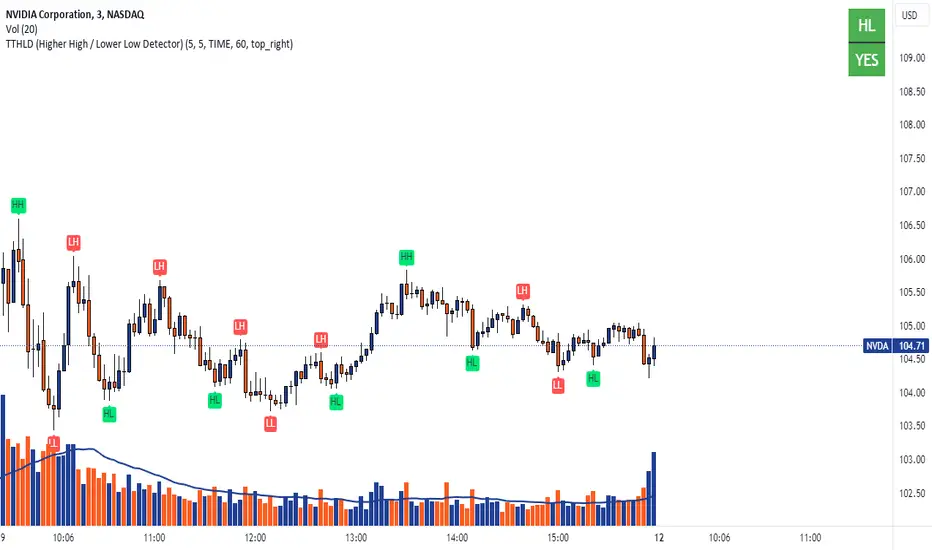
The "TTHLD (Higher High / Lower Low Detector)" is a powerful TradingView indicator designed to help traders easily identify key market signals—Higher Highs (HH), Lower Lows (LL), Higher Lows (HL), and Lower Highs (LH). This tool simplifies the process of spotting crucial trend reversals and continuations by displaying these signals directly on your chart, along with a custom table that provides instant visual feedback.
Features:
Signal Detection: The indicator automatically detects and labels HH, LL, HL, and LH signals on the chart, helping you to quickly identify trend changes and key market movements.
Customizable Threshold: Users can define a threshold based on time (minutes) or bar count to determine if a HH, LL, HL, or LH signal has occurred within the specified range.
Visual Table Display: A table with two rows is displayed on the chart, providing essential information at a glance:
Last Signal Status: The first row shows the last detected signal (HH, HL, LL, LH) with color coding—green for bullish signals (HH, HL) and red for bearish signals (LL, LH).
Threshold Indicator: The second row displays "YES" or "NO" to indicate whether the defined threshold has been met, with a green background for "YES" and a red background for "NO."
Customizable Table Position: The table can be positioned in any corner of the chart (top-right, top-left, bottom-right, bottom-left), allowing for flexible chart setups.
Benefits:
Quick Market Insights: By clearly marking key signals and showing whether recent market activity meets your defined criteria, this indicator helps you make more informed trading decisions.
Enhanced Visuals: The color-coded table provides immediate, easy-to-read information, reducing the time needed to analyze market conditions.
User-Friendly: The indicator is designed to be intuitive and easy to set up, making it accessible for traders of all experience levels.
Conclusion:
The "TTHLD (Higher High / Lower Low Detector)" is an essential tool for traders looking to enhance their market analysis with clear, visual signals and quick decision-making aids. Whether you're monitoring for trend reversals or confirmations, this indicator will give you the edge in understanding market dynamics.
Script protegido
Este script se publica como código cerrado. No obstante, puede utilizarlo libremente y sin ninguna limitación. Obtenga más información aquí.
Exención de responsabilidad
La información y las publicaciones no constituyen, ni deben considerarse como asesoramiento o recomendaciones financieras, de inversión, de trading o de otro tipo proporcionadas o respaldadas por TradingView. Más información en Condiciones de uso.