OPEN-SOURCE SCRIPT
Actualizado Bitcoin Fair Price Calculator [bitcoinfairprice.com]
1. Purpose of the scriptLong-term Bitcoin valuation based on historical time (days since Genesis block)
Fair Price = theoretically “fair” price according to power law.
Bottom Price = lower support (historically ~58% below Fair Price).
Daily display as on the website – without external access.
Buy/sell signals in case of strong overvaluation/undervaluation.
2. Mathematical model (original formula)pinescript
Bottom Price = Fair Price × 0.42
→ Corresponds historically to ~58% below Fair Price.
Days since Genesis block are calculated automatically per bar.
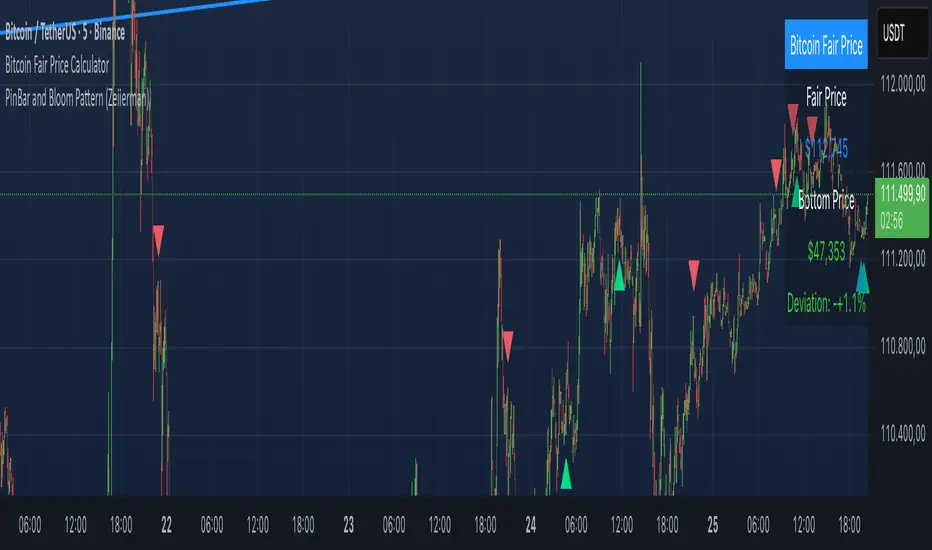
3. What is displayed in the chart?
Fair Price Average power law line (“fair price”) Blue
Bottom Price Lower support (“floor”) Green
Power Law Corridor Filled area between 0.1× and 2.5× Fair Price Light blue (transparent)
Table (top right) Daily values as on the website Black with white text
Label (for >20% deviation) Shows current prices + percentage Red (overvalued) / Green (undervalued)
4. Recommended use Timeframe
Recommendation Weekly / Monthly Best long-term signals
Daily Good balance
Log scale Be sure to activate! (Right-click on Y-axis → “Logarithmic scale”)
9. Strategy tips (based on the model)
Price near bottom --> Buy / accumulate
Price > 2.5× fair price --> Sell part of position / caution
Price between fair & bottom --> Strong buy zone
Deviation < -20% --> HODL signal
Translated with DeepL.com (free version)
Fair Price = theoretically “fair” price according to power law.
Bottom Price = lower support (historically ~58% below Fair Price).
Daily display as on the website – without external access.
Buy/sell signals in case of strong overvaluation/undervaluation.
2. Mathematical model (original formula)pinescript
Bottom Price = Fair Price × 0.42
→ Corresponds historically to ~58% below Fair Price.
Days since Genesis block are calculated automatically per bar.
3. What is displayed in the chart?
Fair Price Average power law line (“fair price”) Blue
Bottom Price Lower support (“floor”) Green
Power Law Corridor Filled area between 0.1× and 2.5× Fair Price Light blue (transparent)
Table (top right) Daily values as on the website Black with white text
Label (for >20% deviation) Shows current prices + percentage Red (overvalued) / Green (undervalued)
4. Recommended use Timeframe
Recommendation Weekly / Monthly Best long-term signals
Daily Good balance
Log scale Be sure to activate! (Right-click on Y-axis → “Logarithmic scale”)
9. Strategy tips (based on the model)
Price near bottom --> Buy / accumulate
Price > 2.5× fair price --> Sell part of position / caution
Price between fair & bottom --> Strong buy zone
Deviation < -20% --> HODL signal
Translated with DeepL.com (free version)
Notas de prensa
1. Purpose of the scriptLong-term Bitcoin valuation based on historical time (days since Genesis block)Fair Price = theoretically “fair” price according to power law.
Bottom Price = lower support (historically ~58% below Fair Price).
Daily display as on the website – without external access.
Buy/sell signals in case of strong overvaluation/undervaluation.
2. Mathematical model (original formula)pinescript
Bottom Price = Fair Price × 0.42
→ Corresponds historically to ~58% below Fair Price.
Days since Genesis block are calculated automatically per bar.
3. What is displayed in the chart?
Fair Price Average power law line (“fair price”) Blue
Bottom Price Lower support (“floor”) Green
Power Law Corridor Filled area between 0.1× and 2.5× Fair Price Light blue (transparent)
Table (top right) Daily values as on the website Black with white text
Label (for >20% deviation) Shows current prices + percentage Red (overvalued) / Green (undervalued)
4. Recommended use Timeframe
Recommendation Weekly / Monthly Best long-term signals
Daily Good balance
Log scale Be sure to activate! (Right-click on Y-axis → “Logarithmic scale”)
5. Strategy tips (based on the model)
Price near bottom --> Buy / accumulate
Price > 2.5× fair price --> Sell part of position / caution
Price between fair & bottom --> Strong buy zone
Deviation < -20% --> HODL signal
Script de código abierto
Siguiendo fielmente el espíritu de TradingView, el creador de este script lo ha publicado en código abierto, permitiendo que otros traders puedan revisar y verificar su funcionalidad. ¡Enhorabuena al autor! Puede utilizarlo de forma gratuita, pero tenga en cuenta que la publicación de este código está sujeta a nuestras Normas internas.
Exención de responsabilidad
La información y las publicaciones que ofrecemos, no implican ni constituyen un asesoramiento financiero, ni de inversión, trading o cualquier otro tipo de consejo o recomendación emitida o respaldada por TradingView. Puede obtener información adicional en las Condiciones de uso.