PROTECTED SOURCE SCRIPT
Capitulation Finder By MChiestes
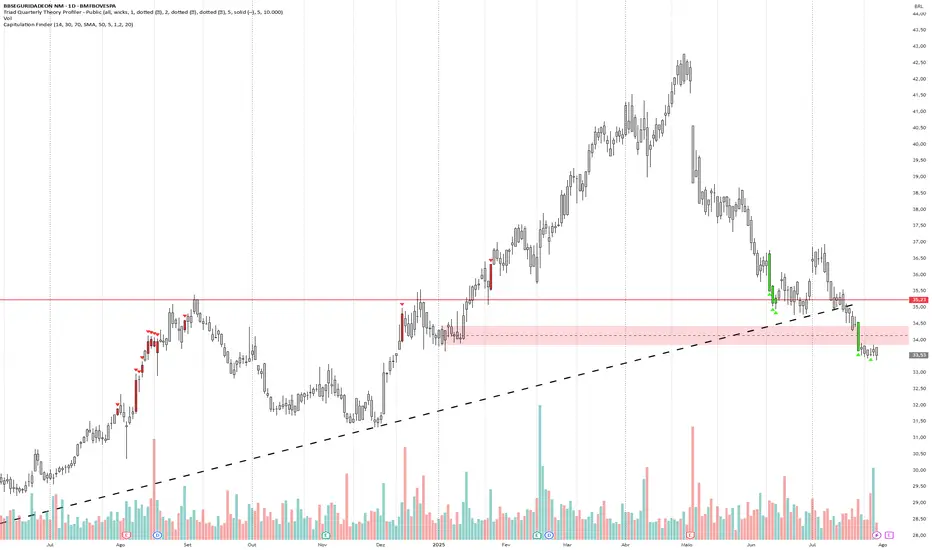
The **'Capitulation Finder' indicator** is designed to detect extreme market exhaustion points—moments when selling or buying is so intense that a major price reversal may be near. It combines several technical factors to highlight likely "capitulation" events, which traditionally signal *market bottoms* (bullish capitulation) or *tops* (bearish capitulation), using both momentum and volume conditions[1][4][6].
**Input Parameters:**
- **RSI Length / Level:** Controls sensitivity to price momentum. Capitulation is flagged when RSI is oversold (e.g., ≤30) or overbought (e.g., ≥70).
- **Moving Average Type / Length:** Lets you choose as baseline (e.g., SMA, EMA) and its lookback period for price deviation calculations.
- **Distance from MA (%):** Sets how far price must stray from the MA (in %) to meet "extreme" conditions.
- **Volume Multiplier / Avg Length:** Requires the current volume to greatly exceed normal (average) volume, confirming broad market participation.
**How the Indicator Works:**
- **Bullish Capitulation:** Triggers when...
- RSI is *very low* (oversold).
- Price is **well below** the chosen MA by the input %, indicating a sharp drop.
- Current volume is **much greater** (e.g., 1.2x or more) than the average, confirming widespread panic selling.
- **Bearish Capitulation:** Triggers when...
- RSI is *very high* (overbought).
- Price is **well above** the MA, indicating a possible buyer frenzy.
- Volume also spikes, confirming conviction in the move.
**Additional Confirmations:**
Isolated checks also register when just the RSI and volume triggers are met, without considering price-MA distance. This helps identify milder extremes for early warning.
**Visual & Signal Output:**
- **Candle Colors:**
- Neon green: Bullish capitulation (oversold panic, possible buying opportunity).
- Neon red: Bearish capitulation (overbought euphoria, possible selling opportunity).
- Grey: No significant signal.
- **Registered Signals:** For use in alerts or strategies, the indicator flags each type of event.
**Market Philosophy:**
Capitulation combines *extreme momentum*, *distance from trend*, and *massive volume* to identify potential turning points. This methodology is inspired by historic crash/rebound patterns in stocks and crypto[2][3][4]. Not every signal guarantees a reversal, but clusters of signals often mark good risk/reward entries or exits when panic or euphoria runs high.
**Summary Table:**
| Condition | Triggered When... | Signal | Candle Color |
|------------------|--------------------------------------------------------------|--------------------------|--------------|
| Bullish Capitulation | RSI ≤ oversold, Price ≪ MA, High Volume | Reversal Buy Alert | Neon Green |
| Bearish Capitulation | RSI ≥ overbought, Price ≫ MA, High Volume | Reversal Sell Alert | Neon Red |
| Confirmations | Only RSI + High Volume | Mild Buy/Sell Alert | (internal) |
| None | No conditions met | No Action | Grey |
**Typical Use:**
This indicator is best used with other tools, such as support/resistance or higher timeframe trends, and is adjustable to suit different markets (stocks, crypto, etc.) and trading styles[4][6].
**Limitations:**
- Capitulation signals are only *probabilities*, not certainties—a reversal may require confirmation by price action.
- The default settings may need adjustment for slow/fast-moving assets or different timeframes.
- High volume isn't always panic/euphoria—check fundamentals for context[3][4][5].
Let me know if you want the full logic in pseudo-code or need tips for adjusting parameters to your asset or timeframe.
[1]
[2]
[3]
[4]
[5]![Capitulation Candle for Bitcoin and Crypto V1.0 [ADRIDEM]](https://s3.tradingview.com/8/8ORcHHqk_mid.png)
[6]
[7]![HRC - Hash Rate Capitulation [Da_Prof]](https://s3.tradingview.com/2/2RqnyrRr_mid.png)
[8] in.tradingview.com/scripts/capitulation/
[9] tradingview.com/scripts/volume/
[10] in.tradingview.com/scripts/page-496/?sort=recent&video=yes
**Input Parameters:**
- **RSI Length / Level:** Controls sensitivity to price momentum. Capitulation is flagged when RSI is oversold (e.g., ≤30) or overbought (e.g., ≥70).
- **Moving Average Type / Length:** Lets you choose as baseline (e.g., SMA, EMA) and its lookback period for price deviation calculations.
- **Distance from MA (%):** Sets how far price must stray from the MA (in %) to meet "extreme" conditions.
- **Volume Multiplier / Avg Length:** Requires the current volume to greatly exceed normal (average) volume, confirming broad market participation.
**How the Indicator Works:**
- **Bullish Capitulation:** Triggers when...
- RSI is *very low* (oversold).
- Price is **well below** the chosen MA by the input %, indicating a sharp drop.
- Current volume is **much greater** (e.g., 1.2x or more) than the average, confirming widespread panic selling.
- **Bearish Capitulation:** Triggers when...
- RSI is *very high* (overbought).
- Price is **well above** the MA, indicating a possible buyer frenzy.
- Volume also spikes, confirming conviction in the move.
**Additional Confirmations:**
Isolated checks also register when just the RSI and volume triggers are met, without considering price-MA distance. This helps identify milder extremes for early warning.
**Visual & Signal Output:**
- **Candle Colors:**
- Neon green: Bullish capitulation (oversold panic, possible buying opportunity).
- Neon red: Bearish capitulation (overbought euphoria, possible selling opportunity).
- Grey: No significant signal.
- **Registered Signals:** For use in alerts or strategies, the indicator flags each type of event.
**Market Philosophy:**
Capitulation combines *extreme momentum*, *distance from trend*, and *massive volume* to identify potential turning points. This methodology is inspired by historic crash/rebound patterns in stocks and crypto[2][3][4]. Not every signal guarantees a reversal, but clusters of signals often mark good risk/reward entries or exits when panic or euphoria runs high.
**Summary Table:**
| Condition | Triggered When... | Signal | Candle Color |
|------------------|--------------------------------------------------------------|--------------------------|--------------|
| Bullish Capitulation | RSI ≤ oversold, Price ≪ MA, High Volume | Reversal Buy Alert | Neon Green |
| Bearish Capitulation | RSI ≥ overbought, Price ≫ MA, High Volume | Reversal Sell Alert | Neon Red |
| Confirmations | Only RSI + High Volume | Mild Buy/Sell Alert | (internal) |
| None | No conditions met | No Action | Grey |
**Typical Use:**
This indicator is best used with other tools, such as support/resistance or higher timeframe trends, and is adjustable to suit different markets (stocks, crypto, etc.) and trading styles[4][6].
**Limitations:**
- Capitulation signals are only *probabilities*, not certainties—a reversal may require confirmation by price action.
- The default settings may need adjustment for slow/fast-moving assets or different timeframes.
- High volume isn't always panic/euphoria—check fundamentals for context[3][4][5].
Let me know if you want the full logic in pseudo-code or need tips for adjusting parameters to your asset or timeframe.
[1]
[2]
[3]
[4]
[5]
[6]
[7]
[8] in.tradingview.com/scripts/capitulation/
[9] tradingview.com/scripts/volume/
[10] in.tradingview.com/scripts/page-496/?sort=recent&video=yes
Script protegido
Este script se publica como código cerrado. No obstante, puede utilizarlo libremente y sin ninguna limitación. Obtenga más información aquí.
Exención de responsabilidad
La información y las publicaciones no constituyen, ni deben considerarse como asesoramiento o recomendaciones financieras, de inversión, de trading o de otro tipo proporcionadas o respaldadas por TradingView. Más información en Condiciones de uso.