OPEN-SOURCE SCRIPT
SuperScript Filtered (Stable)
🔎 What This Indicator Does
The indicator is a trend and momentum filter.
It looks at multiple well-known technical tools (T3 moving averages, RSI, TSI, and EMA trend) and assigns a score to the current market condition.
• If most tools are bullish → score goes up.
• If most tools are bearish → score goes down.
• Only when the score is very strong (above +75 or below -75), it prints a Buy or Sell signal.
This helps traders focus only on high-probability setups instead of reacting to every small wiggle in price.
________________________________________
⚙️ How It Works
1. T3 Trend Check
o Compares a fast and slow T3 moving average.
o If the fast T3 is above the slow T3 → bullish signal.
o If it’s below → bearish signal.
2. RSI Check
o Uses the Relative Strength Index.
o If RSI is above 50 → bullish momentum.
o If RSI is below 50 → bearish momentum.
3. TSI Check
o Uses the True Strength Index.
o If TSI is above its signal line → bullish momentum.
o If TSI is below → bearish momentum.
4. EMA Trend Check
o Looks at two exponential moving averages (fast and slow).
o If price is above both → bullish.
o If price is below both → bearish.
5. Score System
o Each condition contributes +25 (bullish) or -25 (bearish).
o The total score can range from -100 to +100.
o Score ≥ +75 → Strong Buy
o Score ≤ -75 → Strong Sell
6. Signal Filtering
o Only one buy is allowed until a sell appears (and vice versa).
o A minimum bar gap is enforced between signals to avoid clutter.
________________________________________
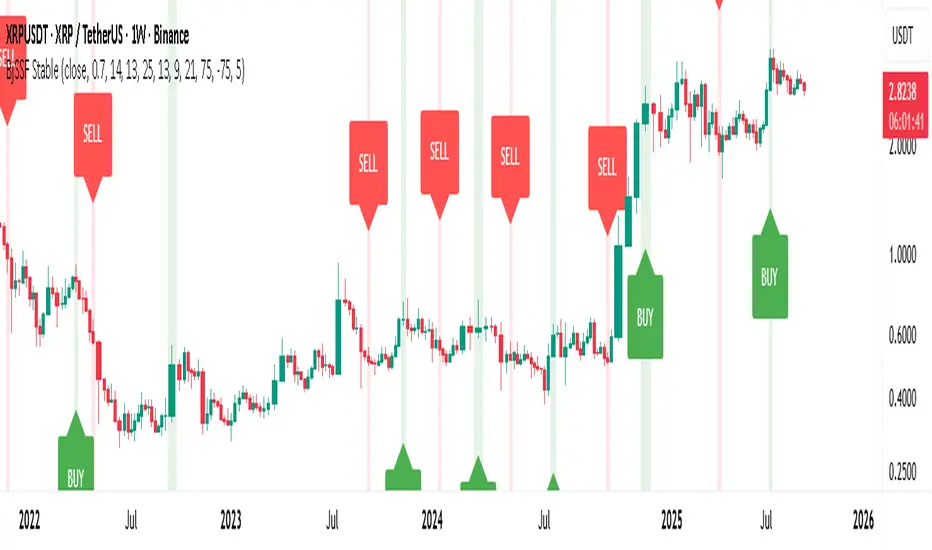
📊 How It Appears on the Chart
• Green “BUY” label below candles → when multiple signals agree and the market is strongly bullish.
• Red “SELL” label above candles → when multiple signals agree and the market is strongly bearish.
• Background softly shaded green or red → highlights bullish or bearish conditions.
No messy tables, no clutter — just clear trend-based entries.
________________________________________
🎯 How Traders Can Use It
This indicator is designed to help traders by:
1. Filtering Noise
o Instead of reacting to every small crossover or RSI blip, it waits until at least 3–4 conditions agree.
o This avoids entering weak trades.
2. Identifying Strong Trend Shifts
o When a Buy or Sell arrow appears, it usually signals a shift in momentum that can lead to a larger move.
3. Reducing Overtrading
o By limiting signals, traders won’t be tempted to jump in and out unnecessarily.
4. Trade Confirmation
o Traders can use the signals as confirmation for their own setups.
o Example: If your strategy says “go long” and the indicator also shows a strong Buy, that trade has more conviction.
5. Alert Automation
o Built-in alerts mean you don’t have to watch the chart all day.
o You’ll be notified only when a strong signal appears.
________________________________________
⚡ When It Helps the Most
• Works best in trending markets (bullish or bearish).
• Very useful on higher timeframes (1h, 4h, daily) for swing trading.
• Can also work on lower timeframes (5m, 15m) if combined with higher timeframe trend filtering.
________________________________________
👉 In short
This indicator is a signal filter + trend detector. It combines four powerful tools into one scoring system, and only tells you to act when the odds are stacked in your favor.
________________________________________
The indicator is a trend and momentum filter.
It looks at multiple well-known technical tools (T3 moving averages, RSI, TSI, and EMA trend) and assigns a score to the current market condition.
• If most tools are bullish → score goes up.
• If most tools are bearish → score goes down.
• Only when the score is very strong (above +75 or below -75), it prints a Buy or Sell signal.
This helps traders focus only on high-probability setups instead of reacting to every small wiggle in price.
________________________________________
⚙️ How It Works
1. T3 Trend Check
o Compares a fast and slow T3 moving average.
o If the fast T3 is above the slow T3 → bullish signal.
o If it’s below → bearish signal.
2. RSI Check
o Uses the Relative Strength Index.
o If RSI is above 50 → bullish momentum.
o If RSI is below 50 → bearish momentum.
3. TSI Check
o Uses the True Strength Index.
o If TSI is above its signal line → bullish momentum.
o If TSI is below → bearish momentum.
4. EMA Trend Check
o Looks at two exponential moving averages (fast and slow).
o If price is above both → bullish.
o If price is below both → bearish.
5. Score System
o Each condition contributes +25 (bullish) or -25 (bearish).
o The total score can range from -100 to +100.
o Score ≥ +75 → Strong Buy
o Score ≤ -75 → Strong Sell
6. Signal Filtering
o Only one buy is allowed until a sell appears (and vice versa).
o A minimum bar gap is enforced between signals to avoid clutter.
________________________________________
📊 How It Appears on the Chart
• Green “BUY” label below candles → when multiple signals agree and the market is strongly bullish.
• Red “SELL” label above candles → when multiple signals agree and the market is strongly bearish.
• Background softly shaded green or red → highlights bullish or bearish conditions.
No messy tables, no clutter — just clear trend-based entries.
________________________________________
🎯 How Traders Can Use It
This indicator is designed to help traders by:
1. Filtering Noise
o Instead of reacting to every small crossover or RSI blip, it waits until at least 3–4 conditions agree.
o This avoids entering weak trades.
2. Identifying Strong Trend Shifts
o When a Buy or Sell arrow appears, it usually signals a shift in momentum that can lead to a larger move.
3. Reducing Overtrading
o By limiting signals, traders won’t be tempted to jump in and out unnecessarily.
4. Trade Confirmation
o Traders can use the signals as confirmation for their own setups.
o Example: If your strategy says “go long” and the indicator also shows a strong Buy, that trade has more conviction.
5. Alert Automation
o Built-in alerts mean you don’t have to watch the chart all day.
o You’ll be notified only when a strong signal appears.
________________________________________
⚡ When It Helps the Most
• Works best in trending markets (bullish or bearish).
• Very useful on higher timeframes (1h, 4h, daily) for swing trading.
• Can also work on lower timeframes (5m, 15m) if combined with higher timeframe trend filtering.
________________________________________
👉 In short
This indicator is a signal filter + trend detector. It combines four powerful tools into one scoring system, and only tells you to act when the odds are stacked in your favor.
________________________________________
Script de código abierto
Fiel al espíritu de TradingView, el creador de este script lo ha convertido en código abierto, para que los traders puedan revisar y verificar su funcionalidad. ¡Enhorabuena al autor! Aunque puede utilizarlo de forma gratuita, recuerde que la republicación del código está sujeta a nuestras Normas internas.
Trade forex, indices, stocks and metals with up to US$100.000 in company's funding.
Complete a challenge to access funding or go for instant deposit.
Trading involves substantial risk. Not financial advice
Complete a challenge to access funding or go for instant deposit.
Trading involves substantial risk. Not financial advice
Exención de responsabilidad
La información y las publicaciones no constituyen, ni deben considerarse como asesoramiento o recomendaciones financieras, de inversión, de trading o de otro tipo proporcionadas o respaldadas por TradingView. Más información en Condiciones de uso.