OPEN-SOURCE SCRIPT
Actualizado 2 Dimensional Array using one floating point entry
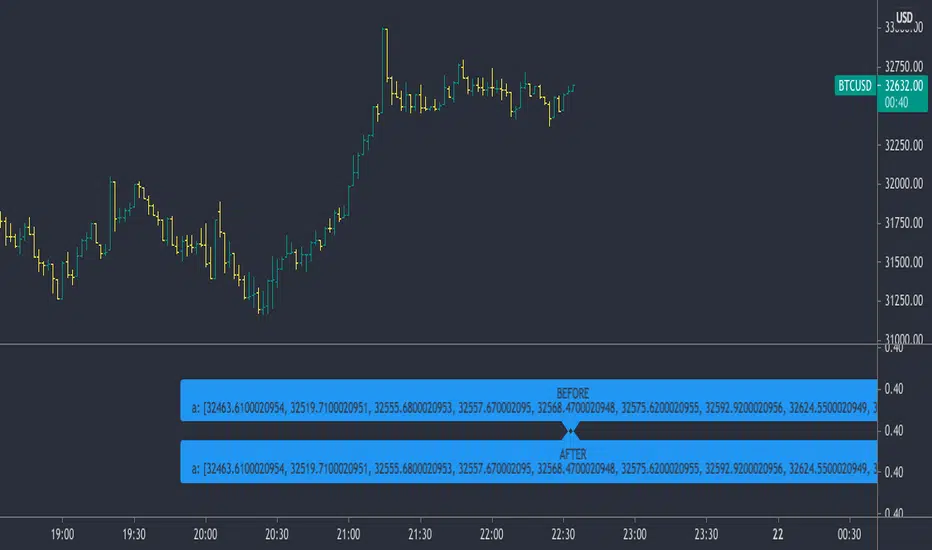
This is an attempt to create a two dimensional floating point array from the pine single dimension array.
It enables some useful array functions like sorting, when you are trying to keep track of price and location in time or bars and you would like to sort the array.
Other array functions on this array will not work, like average and other statistical functions - they will provide bad results. I would suggest continuing to use a single dimensional array for each element where that kind of array function is required.
I wrote this simply as a mean of using the sort functions when I had to sort price and try to keep the bar location or time in synch.
Other array functions could be written to manipulate this kind of array, leave that to others. The goal here was to avoid using for loops which would be a performance impact on large arrays.
The basic concept is to create one floating point number from two, put that into an array, and then be able to pull the compound value out and parse out the individual components.
I imagine it could also accommodate a 3 or 4 dimensional array with some work, as long as you had some idea of how many digits are consumed by each element. For example you may be interested in storing price, RSI, x_loc values and then be able to sort and parse them out.
Notas de prensa
Found a small problem. For whatever reason pine leaves numerical fragments for the bar_index. The values in some instances are off by 1.Added Round() to the parsing function to clean up the fragment and ensure the right value.
Script de código abierto
Fiel al espíritu de TradingView, el creador de este script lo ha convertido en código abierto, para que los traders puedan revisar y verificar su funcionalidad. ¡Enhorabuena al autor! Aunque puede utilizarlo de forma gratuita, recuerde que la republicación del código está sujeta a nuestras Normas internas.
Exención de responsabilidad
La información y las publicaciones no constituyen, ni deben considerarse como asesoramiento o recomendaciones financieras, de inversión, de trading o de otro tipo proporcionadas o respaldadas por TradingView. Más información en Condiciones de uso.