[VIP] ABCD Pattern
The AB=CD pattern is one of the most popular harmonic chart patterns.
Buy and sell signals are generated after the final C-to-D leg, when a reversal is expected to occur.
If the pattern is trending higher, you can look to sell or enter a short position at Point D.
If the pattern is trending lower, you can look to buy the security at Point D in anticipation of a turnaround.
Stop-loss points are best placed just above or below Point D, depending on the direction of the trade.
If the move extends beyond that point, the chart pattern is invalidated and the reversal is less likely to occur.
Take-profit points are typically placed using Fibonacci levels.
For example, you might look for a move back to the original Point A and move a trailing stop-loss to 28.2%, 50% and 61.8% Fibonacci levels along the way.
The AB=CD chart pattern works best when combined with other technical indicators or chart patterns, such as the relative strength index (RSI) or pivot points.
You may also want to use volume as a confirmation of a reversal once the AB=CD chart pattern makes a prediction.
CONFIGURATION
- Strategy ABCD :
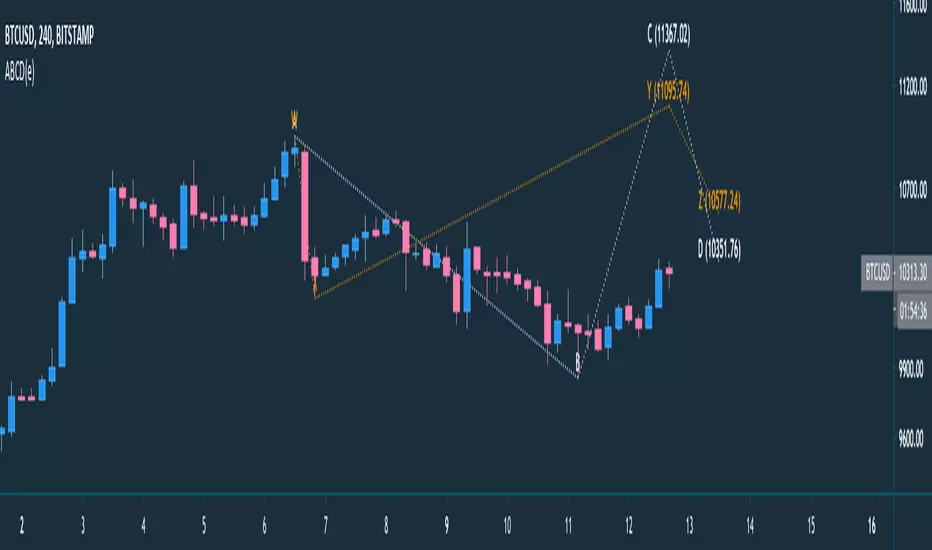
- AB=CD : Leg AB is equal to leg CD
- Ratio : Formula to get leg CD by (AB/0.618) x 1.272 but if
- Forecast : is the continuity of ratio abcd, it is called ABCDE - Different between ABCD vs WXYZ, ABCD is harmonic pattern based on latest chart, but WXYZ based on previous preiodic
- Label style : Balloon will show with comment box, but Text just a simple character without comment shape
- Line style : default is dotted, available values are dashed, solid and dotted
- Colour : change line colour for line and text
- Show label : Display or hide label
Please check link below for but report, trial and join with community
Fixed line CD issue on forecast
Fixed monthly chart issue
Script que requiere invitación
Solo los usuarios autorizados por el autor pueden acceder a este script. Deberá solicitar y obtener permiso para utilizarlo. Por lo general, este se concede tras realizar el pago. Para obtener más información, siga las instrucciones del autor indicadas a continuación o póngase en contacto directamente con deSultanTM.
TradingView NO recomienda pagar por un script ni utilizarlo a menos que confíe plenamente en su autor y comprenda cómo funciona. También puede encontrar alternativas gratuitas y de código abierto en nuestros scripts de la comunidad.
Instrucciones del autor
Exención de responsabilidad
Script que requiere invitación
Solo los usuarios autorizados por el autor pueden acceder a este script. Deberá solicitar y obtener permiso para utilizarlo. Por lo general, este se concede tras realizar el pago. Para obtener más información, siga las instrucciones del autor indicadas a continuación o póngase en contacto directamente con deSultanTM.
TradingView NO recomienda pagar por un script ni utilizarlo a menos que confíe plenamente en su autor y comprenda cómo funciona. También puede encontrar alternativas gratuitas y de código abierto en nuestros scripts de la comunidad.