OPEN-SOURCE SCRIPT
MSTR vs BTCUSD % Movement Comparison
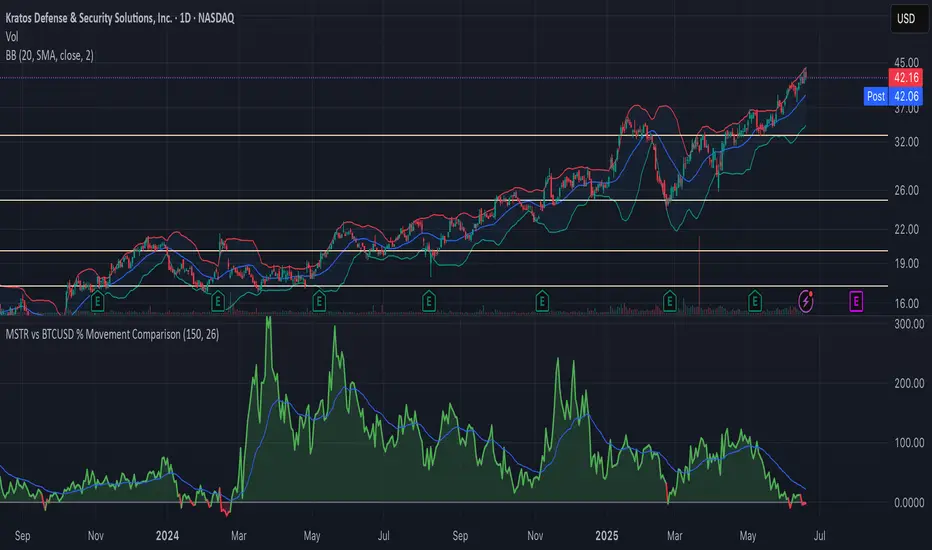
The indicator, in its current form, is a custom Pine Script (version 6) tool named "MSTR vs BTCUSD % Movement Comparison" that visually compares the percentage price movements of MicroStrategy (MSTR) and Bitcoin (BTCUSD) over a user-defined lookback period. It plots the difference in their percentage changes (diff_pct = mstr_pct - btcusd_pct) as a line, with a zero line for reference, and uses green/red coloring to indicate whether MSTR is outperforming (green, above zero) or underperforming (red, below zero) BTCUSD. The area between the difference line and zero line is filled with semi-transparent green or red for clarity. Additionally, an adjustable-period Exponential Moving Average (EMA) of the percentage difference smooths the trend, helping identify momentum shifts. The indicator is fixed to compare MSTR and BTCUSD, ensuring consistent output regardless of the chart’s active symbol (e.g., MSTR, MTPLF, or others).
Key Features:
Percentage Difference: Shows MSTR’s percentage change minus BTCUSD’s, highlighting relative performance.
Zero Line: A gray solid line at 0 for reference.
Color Coding: Green line/fill when MSTR outperforms, red when it underperforms.
Adjustable EMA: User-defined EMA period (default: 26) smooths the percentage difference.
Fixed Comparison: Always compares MSTR vs. BTCUSD, unaffected by the chart’s symbol.
User Inputs: Lookback period (default: 50 bars) and EMA period (default: 26) are customizable.
Example: On a 1-hour chart, if MSTR rises 4% and BTCUSD rises 1% over 50 bars, the difference line plots at +3 (green) with green fill, and the 26-period EMA might be at +2.2, indicating MSTR’s outperformance trend.
Script de código abierto
Fiel al espíritu de TradingView, el creador de este script lo ha convertido en código abierto, para que los traders puedan revisar y verificar su funcionalidad. ¡Enhorabuena al autor! Aunque puede utilizarlo de forma gratuita, recuerde que la republicación del código está sujeta a nuestras Normas internas.
Exención de responsabilidad
La información y las publicaciones no constituyen, ni deben considerarse como asesoramiento o recomendaciones financieras, de inversión, de trading o de otro tipo proporcionadas o respaldadas por TradingView. Más información en Condiciones de uso.