OPEN-SOURCE SCRIPT
Actualizado Market Structure Trend Change by TenAMTrader
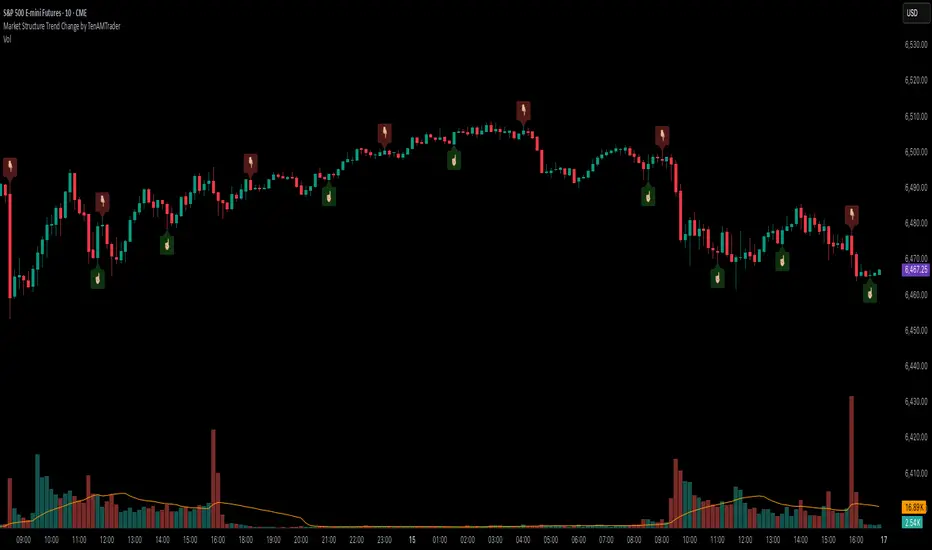
Market Structure Trend Change Indicator
Description:
This indicator detects changes in market trend by analyzing swing highs and lows to identify Higher Highs (HH), Higher Lows (HL), Lower Highs (LH), and Lower Lows (LL). It helps traders quickly see potential reversals and trend continuation points.
Features:
Automatically identifies pivots based on configurable left and right bars.
Labels pivot points (HH, HL, LH, LL) directly on the chart (text-only for clarity).
Generates buy and sell signals when a trend change is detected:
Buy Signal: HL after repeated LLs.
Sell Signal: LH after repeated HHs.
Fully customizable signal appearance: arrow type, circle, label, color, and size.
Adjustable minimum number of repeated highs or lows before a trend change triggers a signal.
Alerts built in for automated notifications when buy/sell signals occur.
Default Settings:
Optimized for a 10-minute chart.
Default “Min repeats before trend change” and pivot left/right bars are set for typical 10-min price swings.
User Customization:
Adjust the “Pivot Left Bars,” “Pivot Right Bars,” and “Min repeats before trend change” to match your trading style, chart timeframe, and volatility.
Enable pivot labels for visual clarity if desired.
Set alerts to receive notifications of trend changes in real time.
How to Use:
Apply the indicator to any chart and timeframe. It works best on swing-trading or trend-following strategies.
Watch for Buy/Sell signals in conjunction with your other analysis, such as volume, support/resistance, or other indicators.
Legal Disclaimer:
This indicator is provided for educational and informational purposes only. It is not financial advice. Trading involves substantial risk, and past performance is not indicative of future results. Users should trade at their own risk and are solely responsible for any gains or losses incurred.
Notas de prensa
Market Structure Trend Change IndicatorDescription:
This indicator detects changes in market trend by analyzing swing highs and lows to identify Higher Highs (HH), Higher Lows (HL), Lower Highs (LH), and Lower Lows (LL). It helps traders quickly see potential reversals and trend continuation points.
Features:
Automatically identifies pivots based on configurable left and right bars.
Labels pivot points (HH, HL, LH, LL) directly on the chart (text-only for clarity).
Generates buy and sell signals when a trend change is detected:
Buy Signal: HL after repeated LLs.
Sell Signal: LH after repeated HHs.
Fully customizable signal appearance: arrow type, circle, label, color, and size.
Adjustable minimum number of repeated highs or lows before a trend change triggers a signal.
Alerts built in for automated notifications when buy/sell signals occur.
Default Settings:
Optimized for a 10-minute chart.
Default “Min repeats before trend change” and pivot left/right bars are set for typical 10-min price swings.
User Customization:
Adjust the “Pivot Left Bars,” “Pivot Right Bars,” and “Min repeats before trend change” to match your trading style, chart timeframe, and volatility.
Enable pivot labels for visual clarity if desired.
Set alerts to receive notifications of trend changes in real time.
How to Use:
Apply the indicator to any chart and timeframe. It works best on swing-trading or trend-following strategies.
Watch for Buy/Sell signals in conjunction with your other analysis, such as volume, support/resistance, or other indicators.
Legal Disclaimer:
This indicator is provided for educational and informational purposes only. It is not financial advice. Trading involves substantial risk, and past performance is not indicative of future results. Users should trade at their own risk and are solely responsible for any gains or losses incurred.
Script de código abierto
Fiel al espíritu de TradingView, el creador de este script lo ha convertido en código abierto, para que los traders puedan revisar y verificar su funcionalidad. ¡Enhorabuena al autor! Aunque puede utilizarlo de forma gratuita, recuerde que la republicación del código está sujeta a nuestras Normas internas.
Exención de responsabilidad
La información y las publicaciones no constituyen, ni deben considerarse como asesoramiento o recomendaciones financieras, de inversión, de trading o de otro tipo proporcionadas o respaldadas por TradingView. Más información en Condiciones de uso.