OPEN-SOURCE SCRIPT
Actualizado New Highs - Marker
Description:
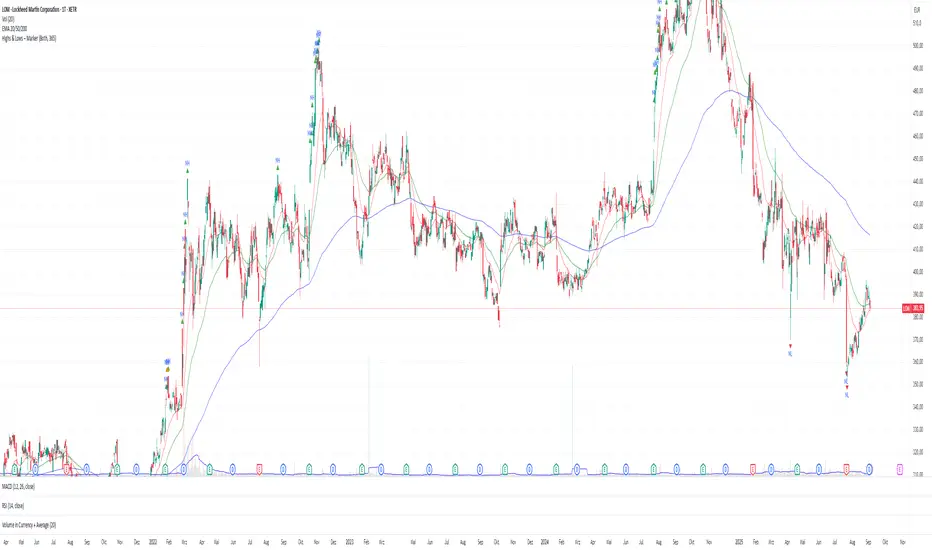
Use this tool to quickly spot breakouts or double-top style patterns as they form.
- This indicator highlights every bar that sets a new high or matches the previous high.
- New Highs (ATH or Lookback Highs) are marked with a green triangle above the candle.
- Equal Highs (ties) are marked with an orange triangle above the candle.
- You can choose between All-Time Highs (lookback = 0) or rolling lookback highs over a user-defined number of bars.
- Alerts are included for both new highs and equal highs.
Use this tool to quickly spot breakouts or double-top style patterns as they form.
Notas de prensa
--this updated version now also shows new lows--New Highs & New Lows – Marker
This indicator automatically highlights new highs and lows on your chart. It works in two modes:
Lookback Mode (Lookback > 0): Marks new highs or lows relative to the last N bars.
Both new extremes and equal highs/lows (ties) can be visualized with different colors and shapes. Alerts are included so you can be notified as soon as new highs or lows appear.
Use this tool to quickly spot breakouts, double tops/bottoms, or potential support/resistance levels.
Features
✅ Detect new highs and new lows
✅ Highlight equal highs and lows (ties)
✅ All-Time or rolling lookback mode
✅ Option to show only highs, only lows, or both
✅ Customizable colors and markers
✅ Built-in alerts for all conditions
Inputs & Settings
Mode: Choose between
B
- oth → Show both highs and lows
- Only Highs → Show only highs
- On
Lookback:
- 0 → All-Time Highs/Lows (since the beginning of the chart)
- >0 → Rolling highs/lows based on the last N bars
- Show New Highs/Lows: Toggle visibility of fresh highs/lows
- S
Colors:
- Green → New Highs
- Orange → Equal Highs
- Red → New Lows
- Ora
Alerts
The indicator includes 4 alert conditions:
- New High – when a bar creates a higher high
- Equal High – when a bar touches the same high
- New Low – when a bar creates a lower low
- Equal Low – when a bar touches the same low
- To enab
How to Use
Add the indicator to your chart.
Choose Lookback = 0 to track all-time highs/lows, or set a number (e.g., 20) for a rolling window.
Select Mode → Highs only, Lows only, or Both.
Customize colors and alerts to fit your strategy.
Watch for markers above/below bars:
Triangles Up (above candles) → Highs
Triangles Down (below candles) → Lows
Script de código abierto
Fiel al espíritu de TradingView, el creador de este script lo ha convertido en código abierto, para que los traders puedan revisar y verificar su funcionalidad. ¡Enhorabuena al autor! Aunque puede utilizarlo de forma gratuita, recuerde que la republicación del código está sujeta a nuestras Normas internas.
Exención de responsabilidad
La información y las publicaciones no constituyen, ni deben considerarse como asesoramiento o recomendaciones financieras, de inversión, de trading o de otro tipo proporcionadas o respaldadas por TradingView. Más información en Condiciones de uso.