OPEN-SOURCE SCRIPT
Actualizado Fed Net Liquidity Indicator
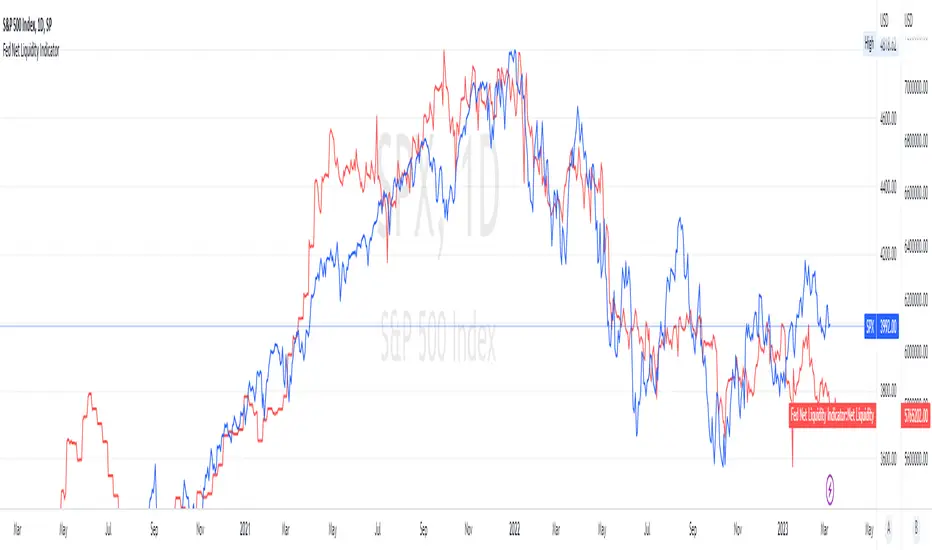
This indicator aims to present a "Net Liquidity" indicator comprised of the Fed Balance sheet , less the TGA account and Overnight Reverse REPO agreements.
Net Liquidity = Fed Balance Sheet - ( TGA + Reverse REPO)
This is an overlay that can be added to stock or other charts (like SPY ) to see how the market may appear correlated to Net Liquidity - injection of liquidity into the markets.
This was hypothesized by Max Anderson, this is just a script realizing that posting.
New updates include a resolution feature, and an option to offset backwards by 2 days per original intent.
Notas de prensa
I have updated the script to fix the units that got changed from the FRED website and imported into TV.I have also updated the script to display the correct units when selecting trillions, billions, and millions.
Notas de prensa
I updated the liquidity indicator to show the Fed Net Liquidity as a line as opposed to a histogram, this fixes the issue with having to scale the background. Should work MUCH better now!!Script de código abierto
Siguiendo fielmente el espíritu de TradingView, el creador de este script lo ha publicado en código abierto, permitiendo que otros traders puedan revisar y verificar su funcionalidad. ¡Enhorabuena al autor! Puede utilizarlo de forma gratuita, pero tenga en cuenta que la publicación de este código está sujeta a nuestras Normas internas.
Exención de responsabilidad
La información y las publicaciones que ofrecemos, no implican ni constituyen un asesoramiento financiero, ni de inversión, trading o cualquier otro tipo de consejo o recomendación emitida o respaldada por TradingView. Puede obtener información adicional en las Condiciones de uso.
Script de código abierto
Siguiendo fielmente el espíritu de TradingView, el creador de este script lo ha publicado en código abierto, permitiendo que otros traders puedan revisar y verificar su funcionalidad. ¡Enhorabuena al autor! Puede utilizarlo de forma gratuita, pero tenga en cuenta que la publicación de este código está sujeta a nuestras Normas internas.
Exención de responsabilidad
La información y las publicaciones que ofrecemos, no implican ni constituyen un asesoramiento financiero, ni de inversión, trading o cualquier otro tipo de consejo o recomendación emitida o respaldada por TradingView. Puede obtener información adicional en las Condiciones de uso.