OPEN-SOURCE SCRIPT
Interval — full-screen verticals + H/L + metrics (robust v6)
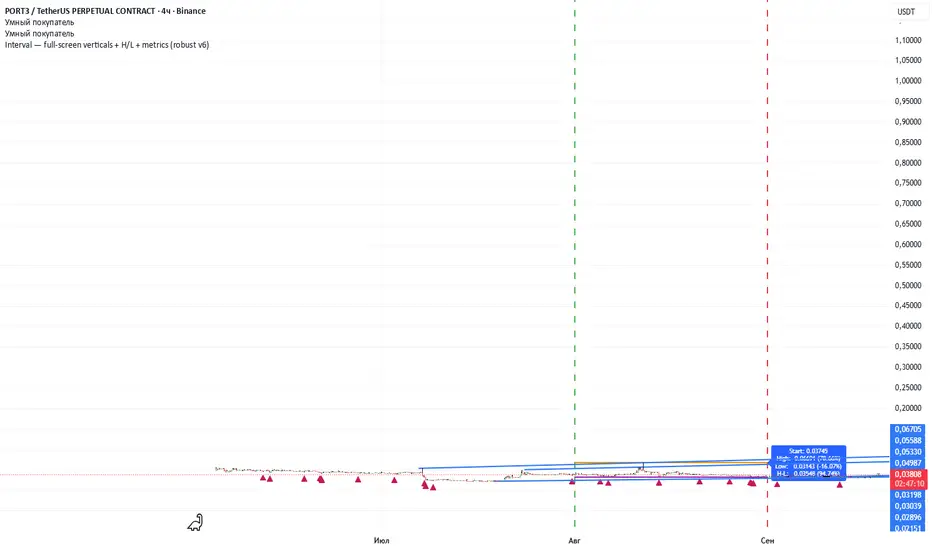
Specify the start date of the analysis and the end date of the analysis, after which 2 vertical lines will appear, the extremes in this period will be marked, and the percentage of deviations will be shown. Next, you can switch assets and see how they behave over the same time interval.
Script de código abierto
Fiel al espíritu de TradingView, el creador de este script lo ha convertido en código abierto, para que los traders puedan revisar y verificar su funcionalidad. ¡Enhorabuena al autor! Aunque puede utilizarlo de forma gratuita, recuerde que la republicación del código está sujeta a nuestras Normas internas.
Exención de responsabilidad
La información y las publicaciones no constituyen, ni deben considerarse como asesoramiento o recomendaciones financieras, de inversión, de trading o de otro tipo proporcionadas o respaldadas por TradingView. Más información en Condiciones de uso.