OPEN-SOURCE SCRIPT
Tremor Tracker [theUltimator5]
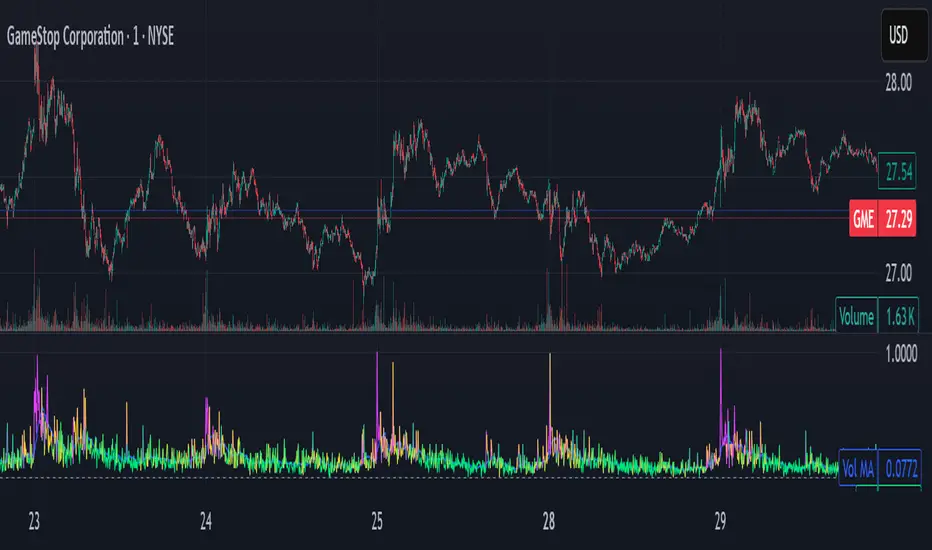
Tremor Tracker is a volatility monitoring tool that visualizes the "tremors" of price action by measuring and analyzing the average volatility of the current trading range, working on any timeframe. This indicator is designed to help traders detect when the market is calm, when volatility is building, and when it enters a potentially unstable or explosive state by using a lookback period to determine the average volatility and highlights outliers.
🔍 What It Does
🟢 Lime — Low volatility (subdued, ranging conditions)
🟡 Yellow — Moderate or building volatility
🟣 Fuchsia — Elevated or explosive volatility
⚙️ Customizable Settings
🧠 Use Cases
📌 Notes
🔍 What It Does
- Calculates bar-level volatility as the percentage difference between the high and low of each candle.
- Applies a user-selected moving average (SMA, EMA, or WMA) to smooth out short-term noise and highlight trends in volatility.
- Compares current volatility to its long-term average over a configurable lookback period.
- Dynamically colors each volatility bar based on how extreme it is relative to historical behavior:
🟢 Lime — Low volatility (subdued, ranging conditions)
🟡 Yellow — Moderate or building volatility
🟣 Fuchsia — Elevated or explosive volatility
⚙️ Customizable Settings
- Low Volatility Limit and High Volatility Limit: Define the thresholds for color changes based on volatility's ratio to its average.
- Volatility MA Length: Adjust the smoothing period for the volatility moving average.
- Average Volatility Lookback: Set how many bars are used to calculate the long-term average.
- MA Type: Choose between SMA, EMA, or WMA for smoothing.
- Show Volatility MA Line?: Toggle the display of the smoothed volatility trendline.
- Show Raw Volatility Bars?: Toggle the display of raw per-bar volatility with dynamic coloring.
🧠 Use Cases
- Identify breakout conditions: When volatility spikes above average, it may signal the onset of a new trend or a news-driven breakout.
- Avoid chop zones: Prolonged periods of low volatility often precede sharp moves — a classic “calm before the storm” setup.
- Timing reversion trades: Detect overextended conditions when volatility is well above historical norms.
- Adapt strategies by volatility regime: Use color feedback to adjust risk, position sizing, or strategy selection based on real-time conditions.
📌 Notes
- Volatility is expressed as a percentage, making this indicator suitable for use across different timeframes and asset classes.
- The tool is designed to be visually intuitive, so traders can quickly spot evolving volatility states without diving into raw numbers.
Script de código abierto
Fiel al espíritu de TradingView, el creador de este script lo ha convertido en código abierto, para que los traders puedan revisar y verificar su funcionalidad. ¡Enhorabuena al autor! Aunque puede utilizarlo de forma gratuita, recuerde que la republicación del código está sujeta a nuestras Normas internas.
Exención de responsabilidad
La información y las publicaciones no constituyen, ni deben considerarse como asesoramiento o recomendaciones financieras, de inversión, de trading o de otro tipo proporcionadas o respaldadas por TradingView. Más información en Condiciones de uso.