PROTECTED SOURCE SCRIPT
VWAP Cloud
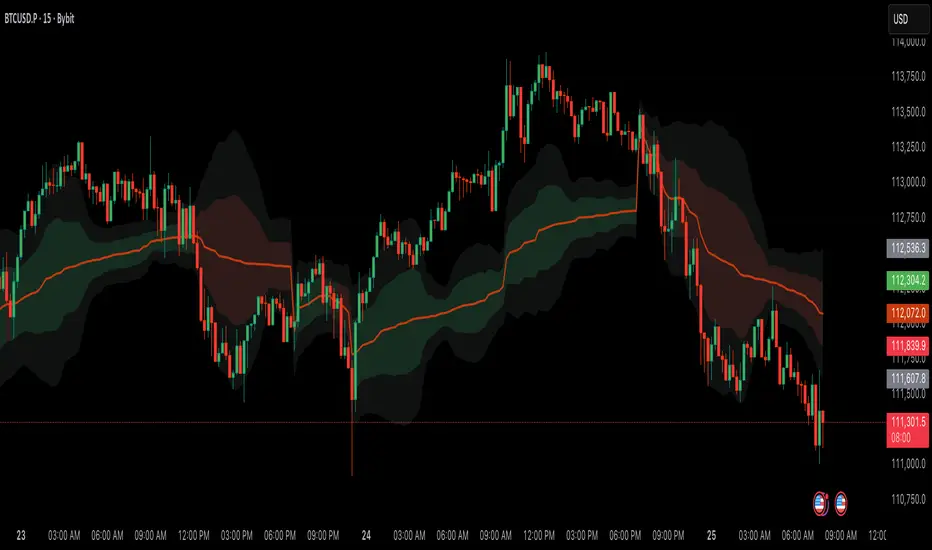
VWAP Cloud
– Dynamic Fair Value Zones with Standard Deviation Envelopes
This script combines a Volume-Weighted Average Price (VWAP) baseline with standard deviation envelopes to create a dynamic "VWAP Cloud."
The VWAP itself is a widely used fair-value benchmark, showing where trading activity is most concentrated relative to price. By adding volatility-based bands around it, this tool helps traders visualize how far price has moved away from VWAP and whether those deviations may represent normal fluctuations or potential extremes.
🔎 How the Components Work Together
VWAP Midline (optional): Provides the session or rolling fair value reference.
Inner Cloud (±1 standard deviation by default): Highlights areas where price is oscillating near VWAP. This zone often reflects balanced conditions, where price is neither excessively stretched nor deeply discounted relative to volume-weighted value.
Outer Cloud (±2 standard deviations by default): Marks wider volatility extremes. These can be used to study how price reacts to statistically significant deviations from VWAP—whether by consolidating, reverting, or extending trends.
Dynamic Coloring: The cloud adjusts color based on VWAP slope. A rising VWAP is shaded green, suggesting positive momentum, while a falling VWAP is shaded red, suggesting negative momentum. Neutral gray highlights the outer envelope to distinguish extreme zones.
⚙️ Inputs & Customization
Source: Select the price type for VWAP calculation (default: hlc3).
Session Reset: Choose between daily resetting VWAP (common for intraday strategies) or a rolling VWAP (continuous view).
Standard Deviation Lookback: Controls the sample window for volatility calculation.
Band Multipliers: Adjust the width of inner and outer clouds.
Midline Toggle: Show or hide the VWAP midline depending on chart preference.
Custom Colors: Configure bullish, bearish, and neutral shading to match your charting style.
📊 How to Use
Trend Context: Price trading above VWAP generally suggests bullish conditions, while trading below suggests bearish conditions.
Value Zones: The inner cloud helps visualize short-term balance around VWAP.
Volatility Extremes: The outer cloud highlights statistically stretched moves that traders may analyze for either continuation or mean-reversion opportunities.
Scalping, Day Trading, Swing Trading: The tool adapts to different styles, depending on whether you reset VWAP each session or use the rolling version.
⚠️ Notes
This script is for educational purposes only and should be combined with other confluence factors, proper risk management, and a trading plan.
It does not generate buy/sell signals on its own. Instead, it provides a framework to study price behavior relative to a dynamic VWAP-based fair value.
Please clean your chart of unrelated drawings/indicators before applying, so the plotted clouds and midline remain clear.
Script protegido
Este script se publica como código cerrado. Sin embargo, puede utilizarlo libremente y sin limitaciones: obtenga más información aquí.
Exención de responsabilidad
La información y las publicaciones que ofrecemos, no implican ni constituyen un asesoramiento financiero, ni de inversión, trading o cualquier otro tipo de consejo o recomendación emitida o respaldada por TradingView. Puede obtener información adicional en las Condiciones de uso.