OPEN-SOURCE SCRIPT
Actualizado Previous Day Week Highs & Lows

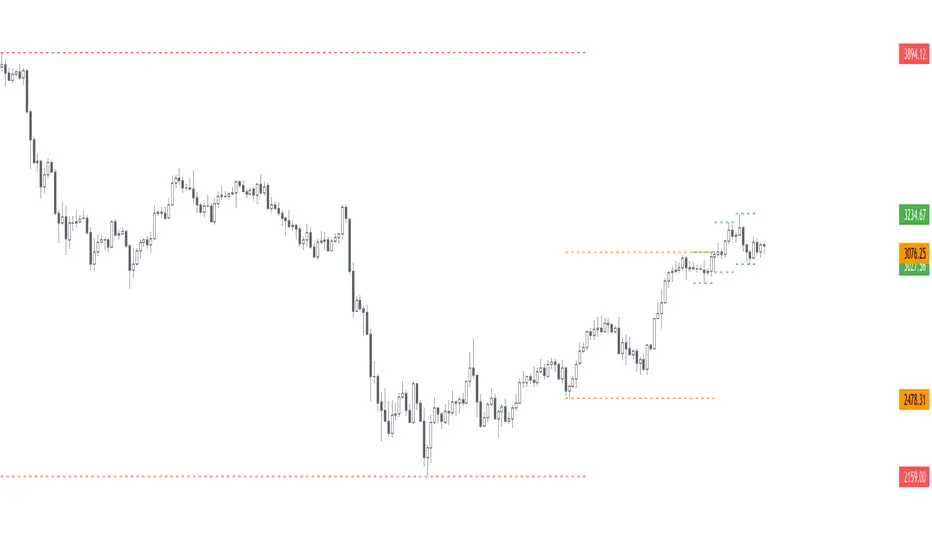
This script plots the previous n day and week highs and lows (previous two days and previous week by default).
Here are some additional info about the script behavior:
Here are some additional info about the script behavior:
- Plots highs and/or lows
- Plots for days and/or weeks
- Day highs and lows are shown only on intraday timeframes
- Week highs and lows are shown only on timeframes < weekly
Notas de prensa
- Add previous month(s) high(s) and low(s)
- Minor fixes and improvements
Script de código abierto
Fiel al espíritu de TradingView, el creador de este script lo ha convertido en código abierto, para que los traders puedan revisar y verificar su funcionalidad. ¡Enhorabuena al autor! Aunque puede utilizarlo de forma gratuita, recuerde que la republicación del código está sujeta a nuestras Normas internas.
🌟 Listed as "Trusted Pine Programmer"
👨💻 Coding services: sbtnc.dev/hire-pine-script-developer
🔒 Premium indicators: sbtnc.gumroad.com
☕️ Tip: buymeacoffee.com/sbtnc
👨💻 Coding services: sbtnc.dev/hire-pine-script-developer
🔒 Premium indicators: sbtnc.gumroad.com
☕️ Tip: buymeacoffee.com/sbtnc
Exención de responsabilidad
La información y las publicaciones no constituyen, ni deben considerarse como asesoramiento o recomendaciones financieras, de inversión, de trading o de otro tipo proporcionadas o respaldadas por TradingView. Más información en Condiciones de uso.