OPEN-SOURCE SCRIPT
Sash Trending Suite NEW

Why
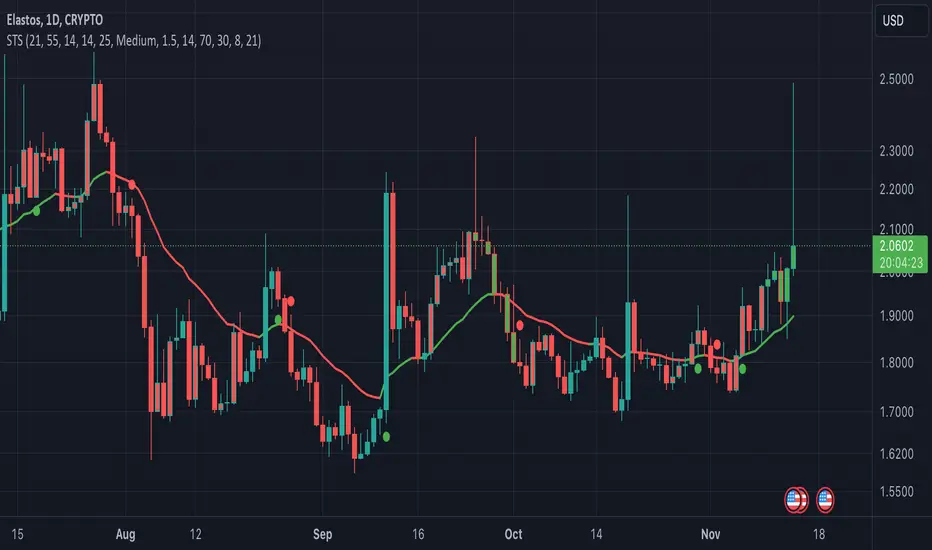
The "Sash Trending Suite" (STS) indicator simplifies trading by highlighting market trends and potential reversals. In a world of complex charts and overwhelming data, STS helps traders quickly understand market direction and make informed decisions.
---
How and What
STS combines key technical tools into one easy-to-read indicator, directly showing important signals on the chart:
---
Summary
The "Sash Trending Suite" provides:
By focusing on essential signals and displaying them clearly, STS helps traders navigate the market with confidence and simplicity.
The "Sash Trending Suite" (STS) indicator simplifies trading by highlighting market trends and potential reversals. In a world of complex charts and overwhelming data, STS helps traders quickly understand market direction and make informed decisions.
---
How and What
STS combines key technical tools into one easy-to-read indicator, directly showing important signals on the chart:
- Macro Trend DetectionHow: Uses two EMAs (fast and slow) and the ADX to identify strong bullish or bearish trends.
What to Look For:
Bar Colors:
Green Bars: Indicate a strong upward (bullish) trend.
Red Bars: Indicate a strong downward (bearish) trend.
Benefit: Quickly see the overall market direction.
- Alpha Track LineHow: An adaptive EMA that acts as a dynamic support or resistance line.
What to Look For:
Line Colors:
Green Line: Price is above the line (bullish momentum).
Red Line: Price is below the line (bearish momentum).
Benefit: Visualize momentum shifts easily.
- Reversal SignalsHow: Combines RSI with price action to spot potential market reversals.
What to Look For:
"R" Labels:
Turquoise "R" Below Bar: Potential bullish reversal.
Amber "R" Above Bar: Potential bearish reversal.
Benefit: Identify possible turning points for entry or exit.
- Micro Trend DetectionHow: Uses shorter EMAs to catch minor trend changes.
What to Look For:
Small Circles:
Green Circle Below Bar: Micro bullish signal.
Red Circle Above Bar: Micro bearish signal.
Benefit: Spot short-term trend shifts promptly.
- Alerts
- How: Built-in alerts notify you of key events.
- What to Expect:
- Trend Changes: Alerts when a new bullish or bearish trend starts.
- Reversals: Alerts for potential bullish or bearish reversals.
- Benefit: Stay updated without constantly watching the chart.
- Trend Changes: Alerts when a new bullish or bearish trend starts.
- How: Built-in alerts notify you of key events.
---
Summary
The "Sash Trending Suite" provides:
- Simplified Analysis: One indicator shows trend direction, momentum, reversals, and micro trends.
- Clear Visuals: Color-coded bars and symbols make interpretation easy.
- Timely Alerts: Know about important market changes instantly.
By focusing on essential signals and displaying them clearly, STS helps traders navigate the market with confidence and simplicity.
Script de código abierto
In true TradingView spirit, the creator of this script has made it open-source, so that traders can review and verify its functionality. Kudos to the author! While you can use it for free, remember that republishing the code is subject to our House Rules.
Exención de responsabilidad
The information and publications are not meant to be, and do not constitute, financial, investment, trading, or other types of advice or recommendations supplied or endorsed by TradingView. Read more in the Terms of Use.