OPEN-SOURCE SCRIPT
Actualizado EMA CROSS v1.0 by Scorpionero
Indicator Description: Multi-Timeframe SMA Table & Plot
This indicator displays a structured table of Simple Moving Averages (SMA) across multiple timeframes and plots them directly on the chart for better trend analysis.
Features:
✅ Multi-Timeframe SMA Calculation: Computes SMAs for different periods (10, 60, and 223) across six timeframes (1m, 3m, 5m, 15m, 30m, 60m).
✅ Sorted SMA Table: Displays a table in the bottom-right corner of the chart, showing the three SMAs per timeframe, sorted in descending order.
✅ Color-Coded Cells: Each SMA is highlighted with a specific color:
🟡 Yellow → 10-period SMA
🔵 Blue → 60-period SMA
🟣 Purple → 223-period SMA
⚪ Gray → Other values
✅ SMA Plotting on the Chart: All calculated SMAs are plotted directly on the price chart, allowing users to visualize their interaction with price movements.
How to Use:
The table provides a quick overview of SMA rankings across timeframes, helping identify bullish or bearish trends.
The SMA plots on the chart can be used for dynamic support/resistance analysis and trend confirmation.
This indicator is ideal for traders who rely on multi-timeframe trend analysis to make informed trading decisions! 🚀
by Scorpionero
Notas de prensa
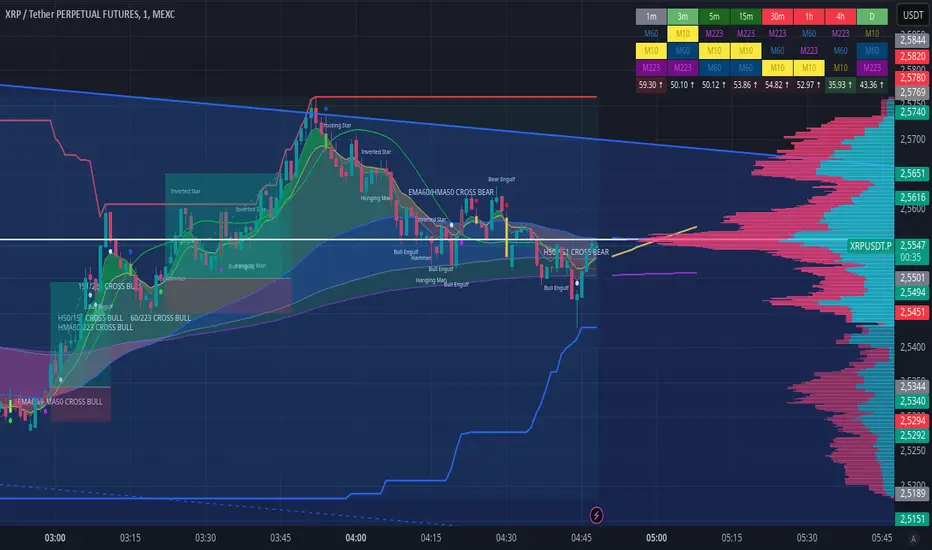
This powerful indicator combines multi-timeframe Exponential Moving Averages (EMAs), trend confirmation, predictive analysis, and advanced candlestick signals to provide traders with an all-in-one decision-making tool. By integrating EMA crossovers, HMA confirmations, RSI insights, and dynamic support/resistance levels, it enhances precision in spotting high-probability trade setups.📌 Key Features:
✅ Multi-Timeframe EMA Calculation
Computes EMAs for 10, 60, 151, and 223 periods across six timeframes (1m, 3m, 5m, 15m, 30m, 60m).
Allows traders to analyze the market structure from multiple perspectives, identifying trend alignments and potential reversals.
✅ Sorted EMA Table for Quick Market Assessment
Displays an intuitive table in the bottom-right corner, showing the EMAs across timeframes.
EMAs are sorted in descending order to quickly identify trend strength and positioning.
EMA positioning relative to price helps determine bullish or bearish dominance.
✅ Color-Coded EMA Highlights
Each EMA is represented with a specific color for better visibility:
🟡 Yellow → 10-period EMA (Short-term trend)
🔵 Blue → 60-period EMA (Medium-term trend)
🔴 Red → 151-period EMA (Momentum filter)
🟣 Purple → 223-period EMA (Long-term trend & trend filter)
⚪ Gray → Other values used for analysis
✅ EMA & HMA53 Crossover Signals
Detects bullish and bearish crossovers between key EMAs to confirm trend shifts.
The HMA53 (Hull Moving Average) acts as a dynamic pivot, indicating potential trade entries when price interacts with it.
"Meetings" between price and HMA53 generate high-probability trade setups.
✅ Predictive EMA Projection
Plots future projections of key EMAs, helping traders anticipate potential trend direction.
Ideal for planning entry and exit points based on expected price behavior.
✅ RSI Multi-Timeframe Integration
Displays Relative Strength Index (RSI) readings across different timeframes.
Helps gauge market strength and identify overbought/oversold conditions in multiple perspectives.
✅ Advanced Candlestick Pattern Recognition
Highlights candlestick patterns such as Engulfing, Doji, and Hammer, which provide confirmation of trend reversals.
“Viagra Candles” – Strong impulse candles that signal aggressive momentum shifts.
“Candles Eating EMAs” – Large-bodied candles that engulf multiple EMAs, signaling potential breakout zones.
✅ Dynamic Support & Resistance Levels
Identifies key price levels based on historical support and resistance zones.
Assists in setting realistic profit targets and stop-loss levels.
📊 How to Use the Indicator:
🔹 EMA Table Analysis: The sorted EMA table provides an instant snapshot of trend alignment across multiple timeframes. If lower timeframe EMAs are above higher timeframe EMAs, the trend is bullish. If they are below, the trend is bearish.
🔹 EMA & HMA53 Interactions: Use price reactions to HMA53 and EMA crossovers as trade signals. Bullish or bearish confirmations occur when price crosses these moving averages with strong volume.
🔹 RSI Trend Confirmation: When RSI aligns with the EMA trends, it confirms momentum strength. A divergence between RSI and price can indicate a potential reversal.
🔹 Candlestick Pattern Recognition:
Use Viagra Candles to confirm strong breakouts.
Candles Eating EMAs act as confirmation for sustained trends.
Traditional candlestick patterns enhance trade timing.
🔹 Predictive EMA Projection: Utilize future EMA plotting to anticipate trend direction and adjust entry/exit strategies accordingly.
🎯 Ideal for Traders Who:
✔️ Rely on multi-timeframe trend analysis to make informed decisions.
✔️ Want a structured EMA strategy with dynamic confirmations.
✔️ Seek high-probability trade setups using HMA interactions, candlestick signals, and RSI confirmations.
✔️ Need an advanced tool for scalping, swing trading, or trend-following strategies.
🚀 Enhance your trading precision with this powerful indicator and ride the trend like never before!
by Scorpionero
by Scorpionero
Script de código abierto
Fiel al espíritu de TradingView, el creador de este script lo ha convertido en código abierto, para que los traders puedan revisar y verificar su funcionalidad. ¡Enhorabuena al autor! Aunque puede utilizarlo de forma gratuita, recuerde que la republicación del código está sujeta a nuestras Normas internas.
Exención de responsabilidad
La información y las publicaciones no constituyen, ni deben considerarse como asesoramiento o recomendaciones financieras, de inversión, de trading o de otro tipo proporcionadas o respaldadas por TradingView. Más información en Condiciones de uso.