INVITE-ONLY SCRIPT
Kenji Indicator Version 2.0
Actualizado
KenJi Indicator Version 2.0
Indicator Class: Average analysis/trend following
Trading type: Any
Time frame: Any
Purpose: Trend-based trading
Level of aggressiveness: Flexible
Introduction
The basic rule of trading is as follows: "trend is your friend." Means, it is extremely important to follow the current market sentiments rather than resisting them. Following this principle allows a trader to feel as comfortable as possible during the trading: positions typically are in a profit zone and there is no psychological pressure of a negative financial result that often leads to hasty position closures.
Despite the advantages of trend-following strategies, many traders struggle to accurately identify the prevailing trend and market sentiments, resulting in bad trading decisions and, consequently, unfavorable trading outcomes.
To address these challenges, streamline the analysis process, and enhance the overall quality of trading decisions, our team of analysts has developed The KenJi Indicator Version 2.0.
About the KenJi Indicator Version 2.0
The KenJi Indicator Version 2.0 offers a novel approach to traditional average-based analysis. Many conventional strategies relying on averages tend to generate numerous false signals, especially in “flat” markets where frequent crossovers and shifts in direction are common. This reduces the overall effectiveness of average analysis.
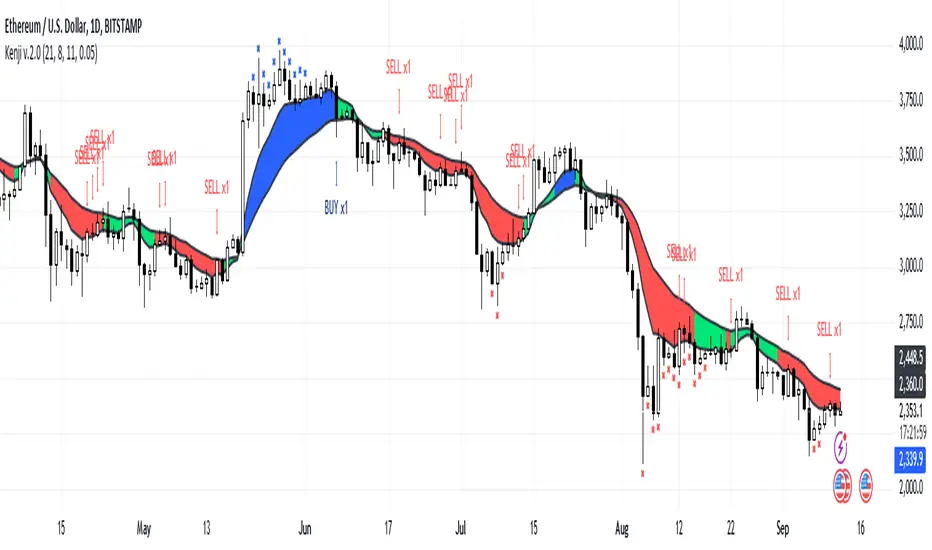
The KenJi Indicator Version 2.0 addresses these issues by incorporating a unique algorithm, which combines correlation and moving average analysis to avoid the pitfalls of traditional methods. It accurately identifies market conditions—indicated by colors: red for a downtrend, blue for an uptrend, and green for a “flat” market—thereby improving the quality of signals and helping traders manage trends more effectively.
The KenJi Indicator Version 2.0 indicator not only identifies optimal entry points but also assists in timing exits for profit-taking. Moreover, it assesses the aggressiveness of signals, making it suitable for both novice and experienced traders.
Trading Rules
Using the KenJi Indicator Version 2.0 is straightforward. When the price enters the buy or sell zone—represented by a blue or red area between the fast and slow averages—it generates a signal to enter a position. This position remains active until the market condition changes (such as a shift from a downtrend to “flat”) or until a close signal appears, indicated by a significant divergence shown by a blue or red cross.
Indicator Structure
The KenJi Indicator Version 2.0 consists of colored zones, level lines and stop crosses:
For ease of use, the indicator shows buy and sell signals directly on the chart.
Signal Types:
Profit zones are marked by blue/red x-crosses: red x-crosses indicate "sell" take-profit zones, while blue x-crosses indicate "buy" take-profit zones.
Alerts and Notifications
The indicator includes built-in alerts and notifications, ensuring traders don’t miss any "buy" or "sell" signals.
Input Parameters
The KenJi Indicator Version 2.0 offers several input parameters for customization:
Access to the KenJi Indicator Version 2.0
For more information or to request access to the Kenji 2.0 Indicator, please send inquiries via private messages.
Indicator Class: Average analysis/trend following
Trading type: Any
Time frame: Any
Purpose: Trend-based trading
Level of aggressiveness: Flexible
Introduction
The basic rule of trading is as follows: "trend is your friend." Means, it is extremely important to follow the current market sentiments rather than resisting them. Following this principle allows a trader to feel as comfortable as possible during the trading: positions typically are in a profit zone and there is no psychological pressure of a negative financial result that often leads to hasty position closures.
Despite the advantages of trend-following strategies, many traders struggle to accurately identify the prevailing trend and market sentiments, resulting in bad trading decisions and, consequently, unfavorable trading outcomes.
To address these challenges, streamline the analysis process, and enhance the overall quality of trading decisions, our team of analysts has developed The KenJi Indicator Version 2.0.
About the KenJi Indicator Version 2.0
The KenJi Indicator Version 2.0 offers a novel approach to traditional average-based analysis. Many conventional strategies relying on averages tend to generate numerous false signals, especially in “flat” markets where frequent crossovers and shifts in direction are common. This reduces the overall effectiveness of average analysis.
The KenJi Indicator Version 2.0 addresses these issues by incorporating a unique algorithm, which combines correlation and moving average analysis to avoid the pitfalls of traditional methods. It accurately identifies market conditions—indicated by colors: red for a downtrend, blue for an uptrend, and green for a “flat” market—thereby improving the quality of signals and helping traders manage trends more effectively.
The KenJi Indicator Version 2.0 indicator not only identifies optimal entry points but also assists in timing exits for profit-taking. Moreover, it assesses the aggressiveness of signals, making it suitable for both novice and experienced traders.
Trading Rules
Using the KenJi Indicator Version 2.0 is straightforward. When the price enters the buy or sell zone—represented by a blue or red area between the fast and slow averages—it generates a signal to enter a position. This position remains active until the market condition changes (such as a shift from a downtrend to “flat”) or until a close signal appears, indicated by a significant divergence shown by a blue or red cross.
Indicator Structure
The KenJi Indicator Version 2.0 consists of colored zones, level lines and stop crosses:
- Trend Zones: These are color-coded (blue, red, or green) to highlight trend conditions and entry points.
- Level Lines: The lines indicate the nearest support/resistance lines (red for resistance, blue for support). Available for 4H time-frame and below
- Stop Crosses: Blue or Red crosses are displayed on the Chart to show the moments of extreme price divergence from the current trend. A good moment to fix profits.
For ease of use, the indicator shows buy and sell signals directly on the chart.
Signal Types:
- Standard: Uses the basic lot size for trades.
- Aggressive: Uses double the standard lot size for higher risk/reward trades.
Profit zones are marked by blue/red x-crosses: red x-crosses indicate "sell" take-profit zones, while blue x-crosses indicate "buy" take-profit zones.
Alerts and Notifications
The indicator includes built-in alerts and notifications, ensuring traders don’t miss any "buy" or "sell" signals.
Input Parameters
The KenJi Indicator Version 2.0 offers several input parameters for customization:
- Slow Average Period: Defines the period for the slow average. Longer periods provide a more stable, conservative response to price changes.
- Fast Average Period: Defines the period for the fast average. Similar to the slow average, a longer period provides more conservative signals.
- Correlation Period: Used to calculate the Pearson correlation coefficient and estimate the relationship between the fast and slow averages, improving trend identification.
- Divergence Sensitivity: Determines the placement of take-profit zones, with higher values increasing the distance of these zones.
Access to the KenJi Indicator Version 2.0
For more information or to request access to the Kenji 2.0 Indicator, please send inquiries via private messages.
Notas de prensa
Additional input parameters are incorporated:- Sell Text Color - is responsible for the text color of SELL signal on the chart;
- Buy Text Color - is responsible for the text color of BUY signal on the chart.
Script que requiere invitación
El acceso a este script está restringido a los usuarios autorizados por el autor y, por regla general, es de pago. Puede añadirlo a sus favoritos, pero solo podrá usarlo si solicita permiso al autor y éste le autoriza. Para obtener más información, póngase en contacto con KenJi_Indicator_2 o siga las siguientes instrucciones del autor.
TradingView recomienda no comprar ni utilizar un script si su autor no le ofrece total confianza o cuando no entienda cómo funciona. En muchos casos, puede encontrar una buena alternativa de código abierto de forma gratuita en nuestros Scripts de la comunidad.
Instrucciones del autor
″For more information or to request access to the KenJi Indicator Version 2.0, please send inquiries via private messages.
¿Quiere utilizar este script en un gráfico?
Advertencia: Por favor, leer antes de solicitar acceso.
Exención de responsabilidad
La información y las publicaciones que ofrecemos, no implican ni constituyen un asesoramiento financiero, ni de inversión, trading o cualquier otro tipo de consejo o recomendación emitida o respaldada por TradingView. Puede obtener información adicional en las Condiciones de uso.