OPEN-SOURCE SCRIPT
Hitokiri rsi and bb
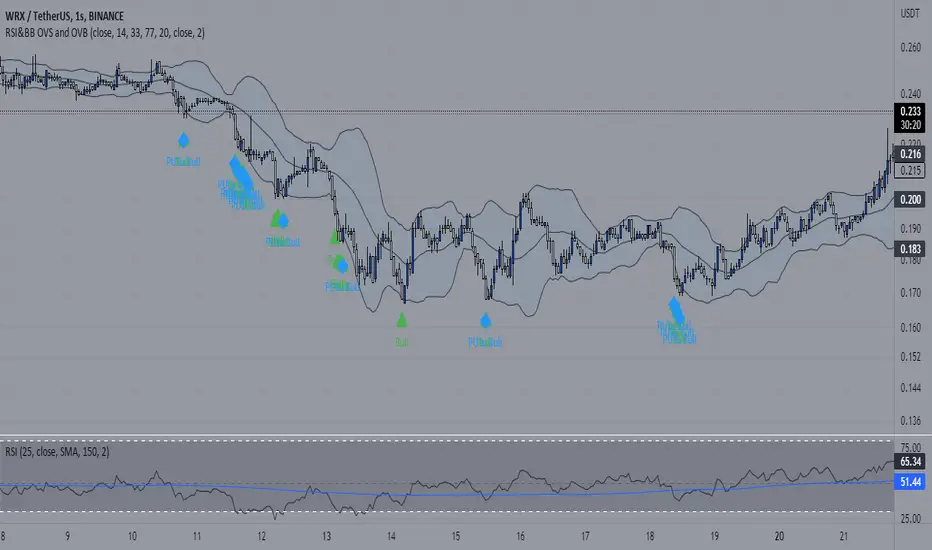
NG : This indicator is created by combining the standard period RSI indicator with an Oversold limit of 32, an Overbought limit of 70 and a period of 14 (these values can be changed optionally from the entries and still tabs of the indicator settings) and the Bollinger Band . indicator with a standard deviation of 2 and a period of 20. Also, the RSI Oversold is an upward green triangle where the price simultaneously falls below the BB and the lower limit (Low) (i.e. below 32), where the RSI Overbought (i.e. above 70) at the same time the price rises above the BB and the upper limit (Upper) is a downward red triangle. is indicated by a triangle. An alarm condition is established on these conditions. Source codes are posted visually and written in clear language and with explanations for beginners to learn to pine.
TR : Bu gösterge OverSold sınırı 32, OverBought sınırı 70 ve periodu 14 olan (bu değerler tercihe göre indikatör ayarlarının girdiler ve still sekmelerinden değiştirilebilir) standart periodluk RSI göstergesi ile standart sapma değeri 2, periodu 20 olan Bollinger Bandı göstergesinin birleştirilmesiyle oluşturulmuş olup ilaveten RSI'nin OverSold iken (yani 32 altına düştüğü) aynı anda fiyatın BBand alt sınırı (Lower) altına düştüğü yerleri yukarı yönlü yeşil üçgenle, RSI'nin OverBought iken (yani 70 üstüne çıktığı) aynı anda fiyatın BBand üst sınırı (Upper) üstüne çıktığı yerleri aşağı yönlü kırmızı üçgenle belirtmektedir. Bu şartlar üzerine de alarm kondüsyonu oluşturulmuştur. Kaynak kodları görünür olarak yayınlanmış olup, pine öğrenmeye yeni başlayanlar için anlaşılır dilde ve açıklamalar eklenerek yazılmıştır.
TR : Bu gösterge OverSold sınırı 32, OverBought sınırı 70 ve periodu 14 olan (bu değerler tercihe göre indikatör ayarlarının girdiler ve still sekmelerinden değiştirilebilir) standart periodluk RSI göstergesi ile standart sapma değeri 2, periodu 20 olan Bollinger Bandı göstergesinin birleştirilmesiyle oluşturulmuş olup ilaveten RSI'nin OverSold iken (yani 32 altına düştüğü) aynı anda fiyatın BBand alt sınırı (Lower) altına düştüğü yerleri yukarı yönlü yeşil üçgenle, RSI'nin OverBought iken (yani 70 üstüne çıktığı) aynı anda fiyatın BBand üst sınırı (Upper) üstüne çıktığı yerleri aşağı yönlü kırmızı üçgenle belirtmektedir. Bu şartlar üzerine de alarm kondüsyonu oluşturulmuştur. Kaynak kodları görünür olarak yayınlanmış olup, pine öğrenmeye yeni başlayanlar için anlaşılır dilde ve açıklamalar eklenerek yazılmıştır.
Script de código abierto
Fiel al espíritu de TradingView, el creador de este script lo ha convertido en código abierto, para que los traders puedan revisar y verificar su funcionalidad. ¡Enhorabuena al autor! Aunque puede utilizarlo de forma gratuita, recuerde que la republicación del código está sujeta a nuestras Normas internas.
Exención de responsabilidad
La información y las publicaciones no constituyen, ni deben considerarse como asesoramiento o recomendaciones financieras, de inversión, de trading o de otro tipo proporcionadas o respaldadas por TradingView. Más información en Condiciones de uso.