PROTECTED SOURCE SCRIPT
Actualizado Probabilistic Trend Indicator
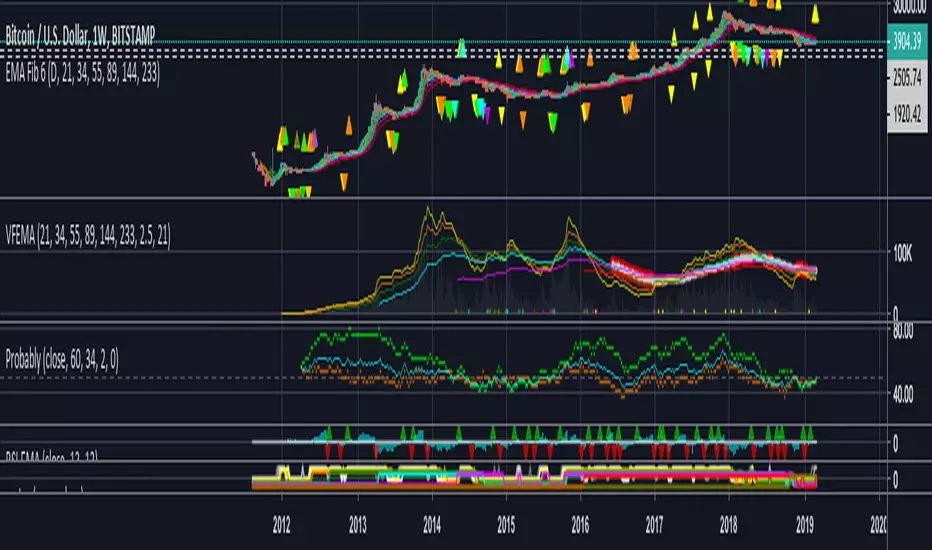
An indicator which attempts to assert the probability of the trend based on a given Sample Size and Look-Back Confirmation Size.
The green dots indicate the probability given to price.
The orange dots indicate the probability given to volume.
The aqua line is a weighted average between them.
The Sample Size is the number of candles to include in the entire calculation.
- This number should be higher to gather more data.
The Look-Back Confirmation Size is the number of candles to include, to confirm the current candles relative strength.
- This number should be lower to give a stronger closer relative reading.
Values above 50 indicate a strengthening position toward prices increasing.
- The strength of this value is weakly exponential and may max out around 80
Values below 50 indicate a strengthening position toward prices decreasing.
- The strength of this value is weakly exponential and may max out around 20
~ Enjoy!
Notas de prensa
~ Updates default Sample Size to be slightly smaller+ Adds quality-of-life feature to smooth the Average (this is an EMA applied to the average line)
Notas de prensa
NOTE: This indicator denotes the probability that the next candle will be greater than the previous (it does not denote the magnitude of how much greater it will be, just the likelihood).+ Adds the ability to change the source timeframe
Notas de prensa
+ Adds the ability to gather samples from an alternative timeframe.+ Adds the ability to toggle the alternate timeframe setting.
+ Adds the ability to toggle the weighting of the average.
Script protegido
Este script se publica como código cerrado. No obstante, puede utilizarlo libremente y sin ninguna limitación. Obtenga más información aquí.
Exención de responsabilidad
La información y las publicaciones no constituyen, ni deben considerarse como asesoramiento o recomendaciones financieras, de inversión, de trading o de otro tipo proporcionadas o respaldadas por TradingView. Más información en Condiciones de uso.