INVITE-ONLY SCRIPT
Compression MA (600 Max) [acatwithcharts]
Actualizado

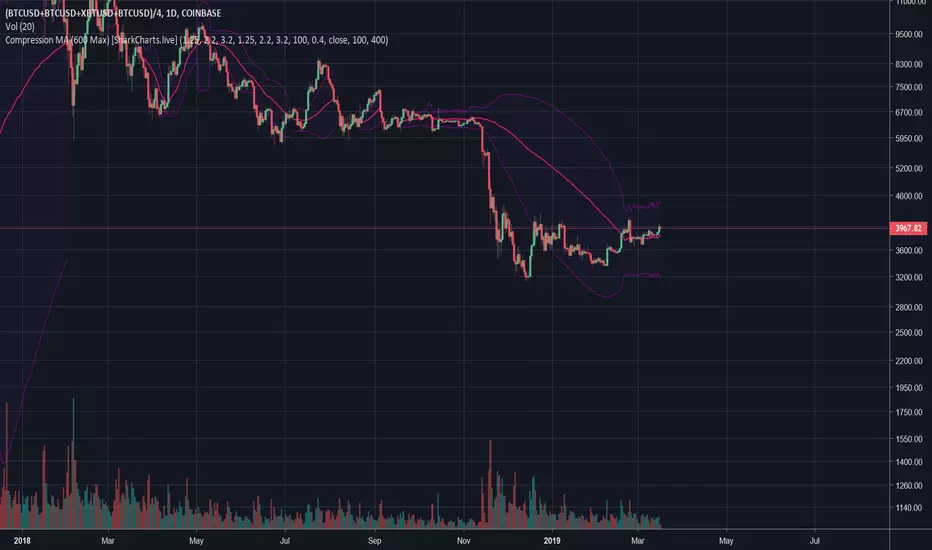
Compression MA is an experimental indicator which modifies Mean Reversion MA with a twist: it instead tracks the most compressed period on a given timeframe as a target for eventual mean reversion. This is a twist on the logic for trading volatility mean reversions in that here we work from the assumption that a period of compression means that there's volatility overhead that should provide resistance to a breakout. The compression MA should therefore help define range-bound areas and help predict intermediate resistances.
This required some tweaking of Mean Reversion MA rather than just making a modification to enable more features on that script, but much of the logic and settings are similar. I've also added an option on this script to turn off tracking and just give the current most compressed period, if any, which creates an entirely different chart and is great for identifying and defining areas of sideways, strongly range-bound compression, which should be scalpable.
This version caps the maximum period length at 600, an empirically-chosen number based on some testing of Mean Reversion MA to try to avoid picking overly distant targets and which dramatically improves stability. In practice, it should be extraordinarily rare for compression MA to need to track something longer than 600, small TFs notwithstanding.
My volatility indicators are available by subscription in several packages through SharkCharts.live - and this is planned to be the first new one ready to add. I plan to release a video explaining how to use this indicator coinciding with launch, as there's a lot to talk about. Videos on my other indicators are currently hosted on DadShark's YouTube channel.
Current pricing and subscription details will be kept up-to-date on SharkCharts.live
Notas de prensa
General refinements ahead of formal release. Adds a separate function with a different color scheme for displaying the current longest overexpanded period.Notas de prensa
Minor visual change in how bands are handled where a period is not being tracked.Notas de prensa
Adds support for showing multiple sets of bands around target means.Script que requiere invitación
El acceso a este script está restringido a los usuarios autorizados por el autor y, por regla general, es de pago. Puede añadirlo a sus favoritos, pero solo podrá usarlo si solicita permiso al autor y éste le autoriza. Para obtener más información, póngase en contacto con acatwithcharts o siga las siguientes instrucciones del autor.
TradingView recomienda no comprar ni utilizar un script si su autor no le ofrece total confianza o cuando no entienda cómo funciona. En muchos casos, puede encontrar una buena alternativa de código abierto de forma gratuita en nuestros Scripts de la comunidad.
¿Quiere utilizar este script en un gráfico?
Advertencia: Por favor, leer antes de solicitar acceso.
My volatility-based indicators are available for sale at SharkCharts.live
Feel free to reach out to me with any questions; more information is available on the SharkCharts website and the SharkCharts discord discord.gg/YVpTeSK
Feel free to reach out to me with any questions; more information is available on the SharkCharts website and the SharkCharts discord discord.gg/YVpTeSK
Exención de responsabilidad
La información y las publicaciones que ofrecemos, no implican ni constituyen un asesoramiento financiero, ni de inversión, trading o cualquier otro tipo de consejo o recomendación emitida o respaldada por TradingView. Puede obtener información adicional en las Condiciones de uso.