PROTECTED SOURCE SCRIPT
Actualizado Sector Performance Table
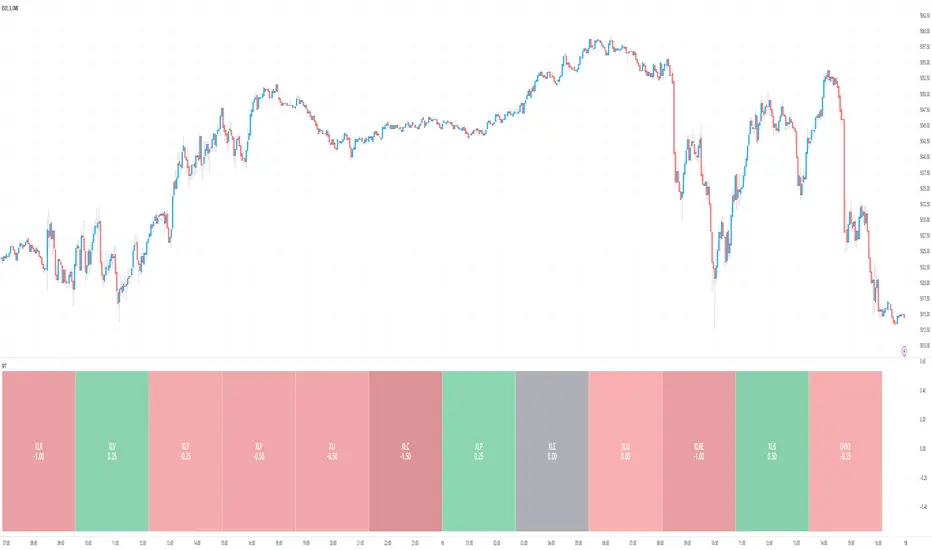
This is a simple performance table for the SPY and its component sectors as well as VIX.
Importantly, the performance is intraday from session open time.
It is NOT a daily change - credit to ShadowTrader for this distinction.
Credit also to PineCoders for their string manipluation instructions for Pine Script.
Each of the 14 symbols in the table can be set by the user.
The table can be placed Top or Bottom, Left or Right
The user will need to set the cell width and height and transparency and bulilsh/ bearish colors to best suit their own displays.
There are two color gradients built in to help illustrate which symbols are leading or lagging
I have also published one for the FANGMANT stocks that is otherwise very similar to this
Notas de prensa
Moved all to one horizontal line and made the VIX rather than VXX the default risk instrumentNotas de prensa
Updated both this and the FANGMANT to have only 12 symbols so they can be the same width and heightThe risk symbols are now in the FANGMANT performance indicator
Notas de prensa
Corrected the overlay and now starting with sectors and last symbol is UVXYNotas de prensa
Updated chart image to reflect all changes since originally builtNotas de prensa
Added the ability to choose percentages independently for max and min gradient shadingNotas de prensa
Added option to choose between change from open and daily changeThis checkbox means you can quickly switch between both to see the difference
Notas de prensa
It has been a while since this was updated so:this adds a lot more customization to users
You can now set parameters in which the neutral color applies
You can set the max and min gradient color tiers for both up and down changes
You can now set text size
Script protegido
Este script se publica como código cerrado. No obstante, puede utilizarlo libremente y sin ninguna limitación. Obtenga más información aquí.
Exención de responsabilidad
La información y las publicaciones no constituyen, ni deben considerarse como asesoramiento o recomendaciones financieras, de inversión, de trading o de otro tipo proporcionadas o respaldadas por TradingView. Más información en Condiciones de uso.