OPEN-SOURCE SCRIPT
Strong Levels (Safe Version)
Strong Levels (Safe Version)
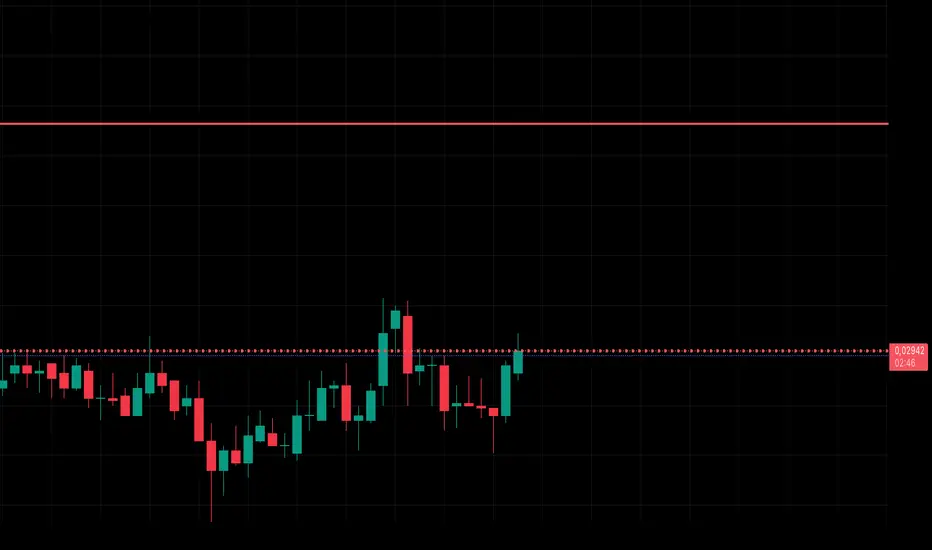
This indicator automatically detects and plots strong support and resistance levels based on pivot highs/lows and the number of touches. It’s designed to highlight only the most reliable levels by filtering with ATR tolerance and minimum touch requirements.
Features:
Detects pivot-based support and resistance zones
Adjustable left/right candles for pivot sensitivity
Minimum touches filter to confirm significant levels
ATR-based tolerance for flexible clustering of nearby levels
Maximum levels limit for cleaner charts
Automatic color coding (teal = support, red = resistance)
Safe version with optimized handling of line objects (up to 500 lines)
Parameters:
Left / Right candles – sensitivity of pivot detection
Min. touches – minimum confirmations required to display a level
ATR period & multiplier – tolerance range for grouping nearby levels
Max levels – limits the number of active levels
Colors – customize support and resistance lines
Usage:
This tool helps traders quickly identify the strongest price levels where market reactions are most likely. Use it to find high-probability entry, exit, or stop-loss zones in any market and timeframe.
Script de código abierto
Siguiendo fielmente el espíritu de TradingView, el creador de este script lo ha publicado en código abierto, permitiendo que otros traders puedan revisar y verificar su funcionalidad. ¡Enhorabuena al autor! Puede utilizarlo de forma gratuita, pero tenga en cuenta que la publicación de este código está sujeta a nuestras Normas internas.
Exención de responsabilidad
La información y las publicaciones que ofrecemos, no implican ni constituyen un asesoramiento financiero, ni de inversión, trading o cualquier otro tipo de consejo o recomendación emitida o respaldada por TradingView. Puede obtener información adicional en las Condiciones de uso.