OPEN-SOURCE SCRIPT
Actualizado Market Snapshot
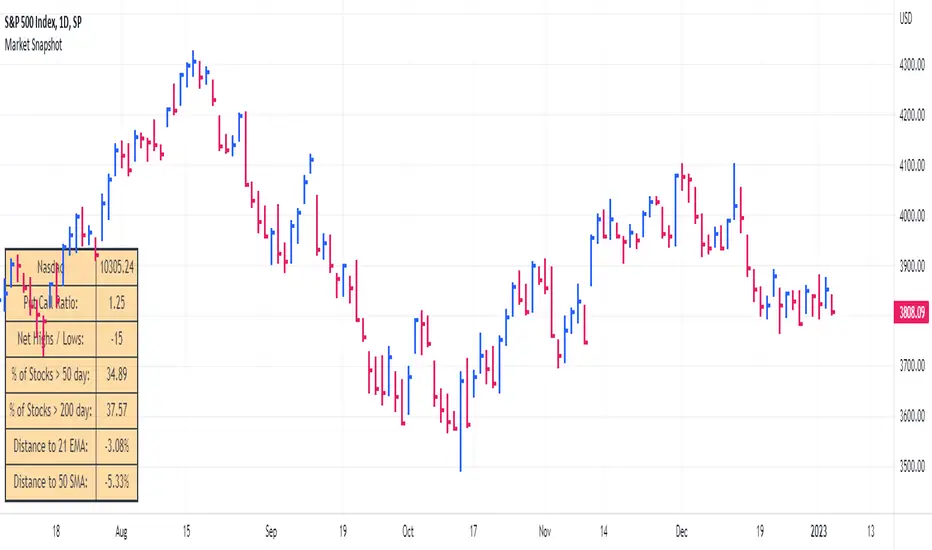
Get a snapshot of the market with the index's last price, distance to selectable moving averages, and breadth data.
Choose to see data based on the Nasdaq or SPX, as well as net highs / lows for the Nasdaq, NYSE or combined.
Snapshot shows:
- Index's (SPX or Nasdaq's) last price
- Put call ratio
- % of stocks above the 50 day moving average for the index of your choice
- % of stocks above the 200 day moving average for the index of your choice
- Distance to or from two selectable moving averages. (negative number means price is below the moving average, positive means price is above)
Configurable options:
- Which moving averages to use
- Where to display the table on your chart
- Table size, background and text colors
Notas de prensa
fixed table sizing Notas de prensa
bug fixScript de código abierto
Fiel al espíritu de TradingView, el creador de este script lo ha convertido en código abierto, para que los traders puedan revisar y verificar su funcionalidad. ¡Enhorabuena al autor! Aunque puede utilizarlo de forma gratuita, recuerde que la republicación del código está sujeta a nuestras Normas internas.
Trusted Pine programmer. Send me a message for script development.
Exención de responsabilidad
La información y las publicaciones no constituyen, ni deben considerarse como asesoramiento o recomendaciones financieras, de inversión, de trading o de otro tipo proporcionadas o respaldadas por TradingView. Más información en Condiciones de uso.
Script de código abierto
Fiel al espíritu de TradingView, el creador de este script lo ha convertido en código abierto, para que los traders puedan revisar y verificar su funcionalidad. ¡Enhorabuena al autor! Aunque puede utilizarlo de forma gratuita, recuerde que la republicación del código está sujeta a nuestras Normas internas.
Trusted Pine programmer. Send me a message for script development.
Exención de responsabilidad
La información y las publicaciones no constituyen, ni deben considerarse como asesoramiento o recomendaciones financieras, de inversión, de trading o de otro tipo proporcionadas o respaldadas por TradingView. Más información en Condiciones de uso.