OPEN-SOURCE SCRIPT
Seasonality Table - [JTCAPITAL]
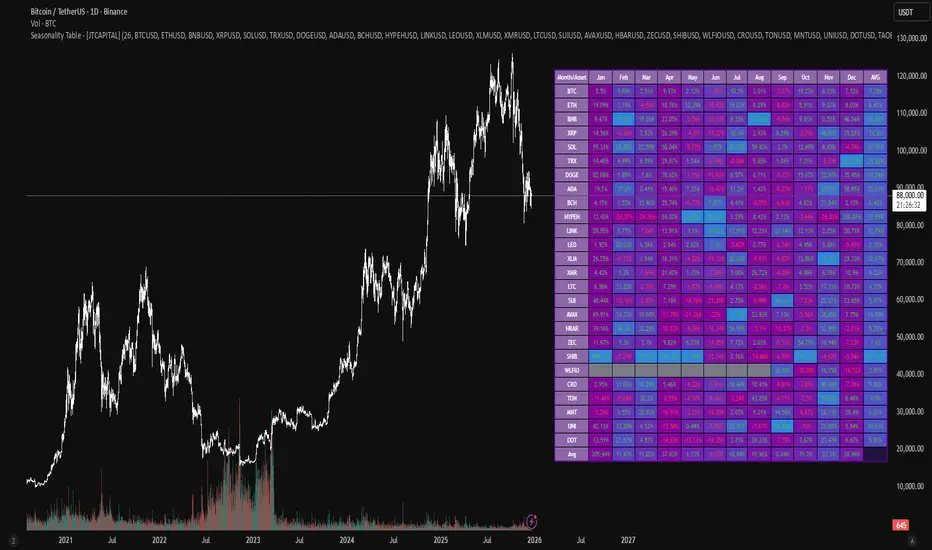
Seasonality Table - [JTCAPITAL] is a modified way to use monthly return aggregation across multiple assets to identify seasonal trends in cryptocurrencies and indices.
The indicator works by calculating in the following steps:
Buy and Sell Conditions
This indicator does not generate explicit buy or sell signals. Instead, it provides a visual heatmap of historical seasonality, allowing traders to:
Identify months where an asset historically outperforms (bullish bias)
Identify months with weak historical performance (bearish caution)
Compare seasonal patterns across multiple assets for portfolio allocation
Filters can be applied by adjusting the asset list, changing the color mapping, or focusing on specific months to highlight seasonal anomalies.
Features and Parameters
Number of assets: Set how many assets are included in the table (1–32).
Assets: Input symbols for the assets you want to analyze.
Low % Color: Defines the color for the lowest monthly returns in the gradient.
High % Color: Defines the color for the highest monthly returns in the gradient.
Cleaned asset names for concise display.
Gradient-based visualization for easier pattern recognition.
Monthly and yearly averages for comparative analysis.
Specifications
Monthly Return Calculation
Uses the formula (Close - Open) / Open for each asset per month. This standardizes performance across different price scales and ensures comparability between assets.
Arrays for Storage
sumReturns: Float array storing cumulative monthly returns.
countReturns: Integer array storing the number of valid data points per month.
These arrays allow efficient aggregation and average calculations without overwriting previous values.
Data Retrieval via Security Calls
Requests monthly OHLC data for each asset using request.security.
Ensures calculations reflect the correct timeframe and allow for historical comparison.
Color and Text Assignment
Green text for positive returns, red for negative returns.
Gray cells indicate missing data.
Gradient background shows relative magnitude within the month.
Seasonality Analysis
The table visually encodes which months historically produce stronger returns.
Useful for portfolio rotation, risk management, and identifying cyclical trends.
Scalability
Supports up to 32 assets.
Dynamically adapts to the number of assets and data availability.
Gradient scales automatically per row for consistent comparison.
The indicator works by calculating in the following steps:
- Asset Selection
The user defines a list of assets to include in the seasonality table. By default, the script allows up to 32 assets, including popular cryptocurrencies like BTC, ETH, BNB, XRP, and others. Each asset is identified by its symbol (e.g., "CRYPTO:BTCUSD"). - Monthly Return Calculation
For each asset, the script requests monthly price data using request.security. Specifically, it retrieves the monthly open, close, and month number. The monthly return is calculated as:
Return = (Close - Open) / Open
This step provides a normalized measure of performance for each asset per month. - Data Aggregation
The script stores two key arrays for each asset and month combination:
sumReturns: The cumulative sum of monthly returns
countReturns: The number of months with valid data
This allows averaging returns later while handling months with missing data gracefully. - Table Construction
Rows representing months (January–December)
Columns representing each asset
An additional column showing the average return for all assets per month
A final row showing the yearly average return for each asset - Filling the Table
The table cells are filled as follows:
Monthly returns are averaged for each asset and displayed as a percentage.
Positive returns are colored green, negative returns red.
Missing data is displayed as a gray “—” placeholder.
Each row’s values are normalized for the color gradient to show relative performance. - Averages Computation
The script calculates two types of averages:
Monthly Average Across Assets: Sum of all asset returns for a month divided by the number of valid data points.
Yearly Average Per Asset: Sum of all monthly returns for an asset divided by the number of months with valid data.
These averages are displayed in the last column and last row respectively, with gradient coloring for visual comparison.
Buy and Sell Conditions
This indicator does not generate explicit buy or sell signals. Instead, it provides a visual heatmap of historical seasonality, allowing traders to:
Identify months where an asset historically outperforms (bullish bias)
Identify months with weak historical performance (bearish caution)
Compare seasonal patterns across multiple assets for portfolio allocation
Filters can be applied by adjusting the asset list, changing the color mapping, or focusing on specific months to highlight seasonal anomalies.
Features and Parameters
Number of assets: Set how many assets are included in the table (1–32).
Assets: Input symbols for the assets you want to analyze.
Low % Color: Defines the color for the lowest monthly returns in the gradient.
High % Color: Defines the color for the highest monthly returns in the gradient.
Cleaned asset names for concise display.
Gradient-based visualization for easier pattern recognition.
Monthly and yearly averages for comparative analysis.
Specifications
Monthly Return Calculation
Uses the formula (Close - Open) / Open for each asset per month. This standardizes performance across different price scales and ensures comparability between assets.
Arrays for Storage
sumReturns: Float array storing cumulative monthly returns.
countReturns: Integer array storing the number of valid data points per month.
These arrays allow efficient aggregation and average calculations without overwriting previous values.
Data Retrieval via Security Calls
Requests monthly OHLC data for each asset using request.security.
Ensures calculations reflect the correct timeframe and allow for historical comparison.
Color and Text Assignment
Green text for positive returns, red for negative returns.
Gray cells indicate missing data.
Gradient background shows relative magnitude within the month.
Seasonality Analysis
The table visually encodes which months historically produce stronger returns.
Useful for portfolio rotation, risk management, and identifying cyclical trends.
Scalability
Supports up to 32 assets.
Dynamically adapts to the number of assets and data availability.
Gradient scales automatically per row for consistent comparison.
Script de código abierto
Fiel al espíritu de TradingView, el creador de este script lo ha convertido en código abierto, para que los traders puedan revisar y verificar su funcionalidad. ¡Enhorabuena al autor! Aunque puede utilizarlo de forma gratuita, recuerde que la republicación del código está sujeta a nuestras Normas internas.
Exención de responsabilidad
La información y las publicaciones no constituyen, ni deben considerarse como asesoramiento o recomendaciones financieras, de inversión, de trading o de otro tipo proporcionadas o respaldadas por TradingView. Más información en Condiciones de uso.