OPEN-SOURCE SCRIPT
TradingCharts SCTR [Bginvestor]
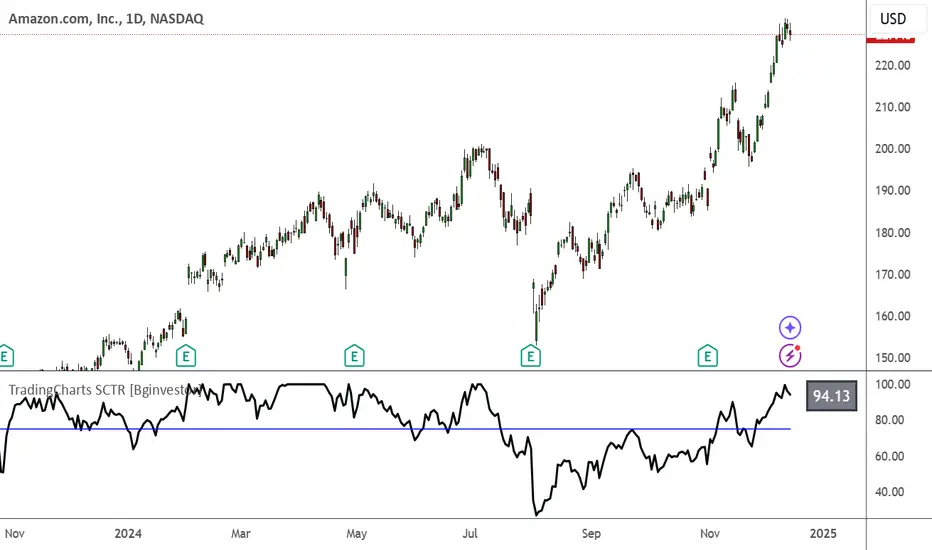
This indicator is replicating Tradingcharts, SCTR plot. If you know, you know.
Brief description: The StockCharts Technical Rank (SCTR), conceived by technical analyst John Murphy, emerges as a pivotal tool in evaluating a stock’s technical prowess. This numerical system, colloquially known as “scooter,” gauges a stock’s strength within various groups, employing six key technical indicators across different time frames.
How to use it:
Long-term indicators (30% weight each)
-Percent above/below the 200-day exponential moving average (EMA)
-125-day rate-of-change (ROC)
Medium-term indicators (15% weight each)
-percent above/below 50-day EMA
-20-day rate-of-change
Short-term indicators (5% weight each)
-Three-day slope of percentage price oscillator histogram divided by three
-Relative strength index
How to use SCTR:
Investors select a specific group for analysis, and the SCTR assigns rankings within that group. A score of 99.99 denotes robust technical performance, while zero signals pronounced underperformance. Traders leverage this data for strategic decision-making, identifying stocks with increasing SCTR for potential buying or spotting weak stocks for potential shorting.
Credit: I've made some modifications, but credit goes to GodziBear for back engineering the averaging / scaling of the equations.
Note: Not a perfect match to TradingCharts, but very, very close.
Script de código abierto
Fiel al espíritu de TradingView, el creador de este script lo ha convertido en código abierto, para que los traders puedan revisar y verificar su funcionalidad. ¡Enhorabuena al autor! Aunque puede utilizarlo de forma gratuita, recuerde que la republicación del código está sujeta a nuestras Normas internas.
Exención de responsabilidad
La información y las publicaciones no constituyen, ni deben considerarse como asesoramiento o recomendaciones financieras, de inversión, de trading o de otro tipo proporcionadas o respaldadas por TradingView. Más información en Condiciones de uso.