OPEN-SOURCE SCRIPT
Actualizado Stablecoin supplies [USD bn]
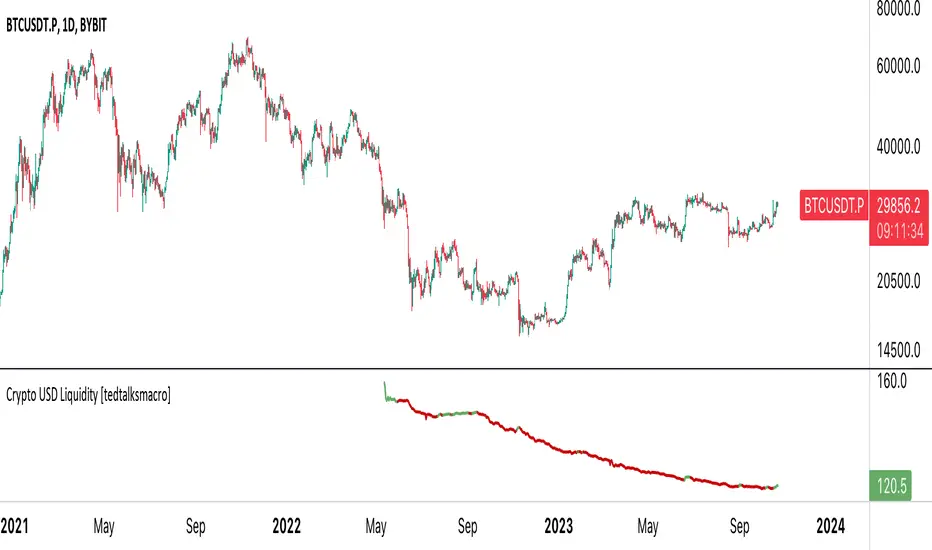
This script shows crypto market inflows/outflows by showing the USD stablecoin supplies, using data from https://glassnode.com/:
 BUSD_SUPPLY
 USDT_SUPPLY
 USDC_SUPPLY
Using a simple 20 EMA, the line will change color showing stablecoin inflow or outflow. Traders can consider stable coin inflows (green) as bullish for Bitcoin price, while stable coin outflows (red) should be considered bearish for price.
Using a simple 20 EMA, the line will change color showing stablecoin inflow or outflow. Traders can consider stable coin inflows (green) as bullish for Bitcoin price, while stable coin outflows (red) should be considered bearish for price.
Notas de prensa
Script title updateNotas de prensa
Designed to visualize the total liquidity of major stablecoins in the cryptocurrency market. The liquidity is calculated by summing the supply values of five leading stablecoins: USDT, BUSD, USDC, DAI, and TUSD. Based on the comparison of the current liquidity value with its EMA, the script colors the plotted line either green (when above the EMA) or red (when below the EMA), helping traders visually identify bullish or bearish liquidity trends.
Script de código abierto
Fiel al espíritu de TradingView, el creador de este script lo ha convertido en código abierto, para que los traders puedan revisar y verificar su funcionalidad. ¡Enhorabuena al autor! Aunque puede utilizarlo de forma gratuita, recuerde que la republicación del código está sujeta a nuestras Normas internas.
Exención de responsabilidad
La información y las publicaciones no pretenden ser, ni constituyen, asesoramiento o recomendaciones financieras, de inversión, de trading o de otro tipo proporcionadas o respaldadas por TradingView. Más información en Condiciones de uso.