OPEN-SOURCE SCRIPT
% Above 50 DMA
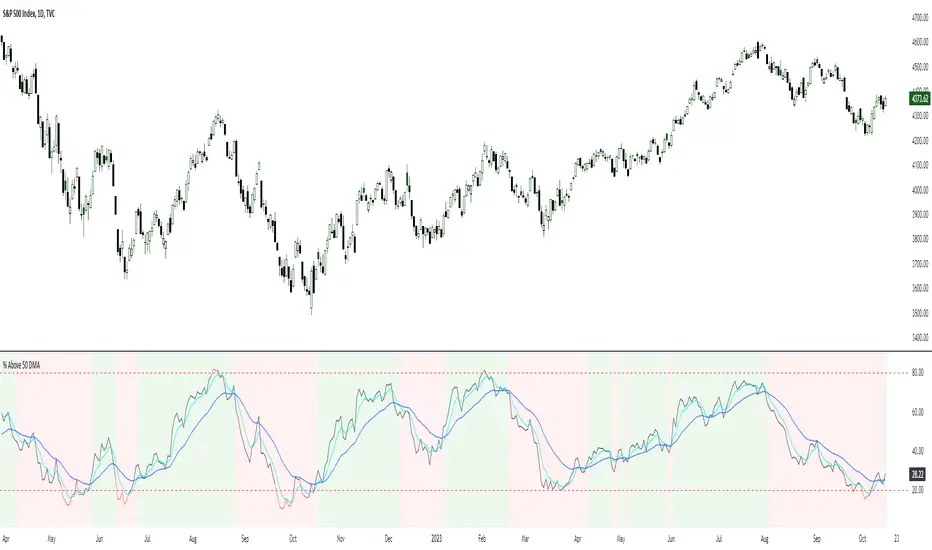
Displays the % of stocks above their 50 day average and the 5 and 20 ema of the indicator. Often the market will trend up when the 5ema is above the 20ema for this indicator, or down when vice versa. The 20% and 80% levels are plotted to show potentially oversold or overbought markets. Select NYSE or Nasdaq in the settings.
Script de código abierto
Fiel al espíritu de TradingView, el creador de este script lo ha convertido en código abierto, para que los traders puedan revisar y verificar su funcionalidad. ¡Enhorabuena al autor! Aunque puede utilizarlo de forma gratuita, recuerde que la republicación del código está sujeta a nuestras Normas internas.
Exención de responsabilidad
La información y las publicaciones no constituyen, ni deben considerarse como asesoramiento o recomendaciones financieras, de inversión, de trading o de otro tipo proporcionadas o respaldadas por TradingView. Más información en Condiciones de uso.