OPEN-SOURCE SCRIPT
EMA/VWAP Suite
EMA/VWAP Suite
Overview
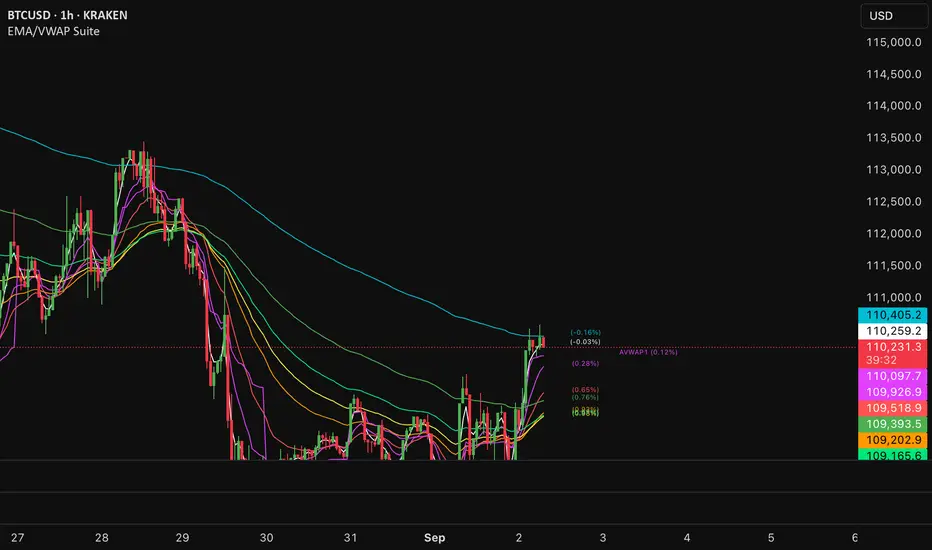
The EMA/VWAP Suite is a versatile and customizable Pine Script indicator designed for traders who want to combine Exponential Moving Averages (EMAs) and Volume Weighted Average Prices (VWAPs) in a single, powerful tool. It overlays up to eight EMAs and six VWAPs (three anchored, three rolling) on the chart, each with percentage difference labels to show how far the current price is from these key levels. This indicator is perfect for technical analysis, supporting strategies like trend following, mean reversion, and VWAP-based trading.
By default, the indicator displays eight EMAs and a session-anchored VWAP (AVWAP 1, in fuchsia) with their respective percentage difference labels, keeping the chart clean yet informative. Other VWAPs and their bands are disabled by default but can be enabled and customized as needed. The suite is designed to minimize clutter while providing maximum flexibility for traders.
Features
- Eight Customizable EMAs: Plot up to eight EMAs with user-defined lengths (default: 3, 9, 19, 38, 50, 65, 100, 200), each with a unique color for easy identification.
- EMA Percentage Difference Labels: Show the percentage difference between the current price and each EMA, displayed only for visible EMAs when enabled.
- Three Anchored VWAPs: Plot VWAPs anchored to the start of a session, week, or month, with customizable source, offset, and band multipliers. AVWAP 1 (session-anchored, fuchsia) is enabled by default.
- Three Rolling VWAPs: Plot VWAPs calculated over fixed periods (default: 20, 50, 100), with customizable source, offset, and band multipliers.
- VWAP Bands: Optional upper and lower bands for each VWAP, based on standard deviation with user-defined multipliers.
- VWAP Percentage Difference Labels: Display the percentage difference between the current price and each VWAP, shown only for visible VWAPs. Enabled by default to show the AVWAP 1 label.
- Customizable Colors: Each VWAP has a user-defined color via input settings, with labels matching the VWAP line colors (e.g., AVWAP 1 defaults to fuchsia).
Flexible Display Options: Toggle individual EMAs, VWAPs, bands, and labels on or off to reduce chart clutter.
Settings
The indicator is organized into intuitive setting groups:
EMA Settings
Show EMA 1–8: Toggle each EMA on or off (default: all enabled).
EMA 1–8 Length: Set the period for each EMA (default: 3, 9, 19, 38, 50, 65, 100, 200).
Show EMA % Difference Labels: Enable/disable percentage difference labels for all EMAs (default: enabled).
EMA Label Font Size (8–20): Adjust the font size for EMA labels (default: 10, mapped to “tiny”).
Anchored VWAP 1–3 Settings
Show AVWAP 1–3: Toggle each anchored VWAP on or off (default: AVWAP 1 enabled, others disabled).
AVWAP 1–3 Color: Set the color for each VWAP line and its label (default: fuchsia for AVWAP 1, purple for AVWAP 2, teal for AVWAP 3).
AVWAP 1–3 Anchor: Choose the anchor period (“Session,” “Week,” “Month”; default: Session for AVWAP 1, Week for AVWAP 2, Month for AVWAP 3).
AVWAP 1–3 Source: Select the price source (default: hlc3).
AVWAP 1–3 Offset: Set the horizontal offset for the VWAP line (default: 0).
Show AVWAP 1–3 Bands: Toggle upper/lower bands (default: disabled).
AVWAP 1–3 Band Multiplier: Adjust the standard deviation multiplier for bands (default: 1.0).
Rolling VWAP 1–3 Settings
Show RVWAP 1–3: Toggle each rolling VWAP on or off (default: disabled).
RVWAP 1–3 Color: Set the color for each VWAP line and its label (default: navy for RVWAP 1, maroon for RVWAP 2, fuchsia for RVWAP 3).
RVWAP 1–3 Period Length: Set the period for the rolling VWAP (default: 20, 50, 100).
RVWAP 1–3 Source: Select the price source (default: hlc3).
RVWAP 1–3 Offset: Set the horizontal offset (default: 0).
Show RVWAP 1–3 Bands: Toggle upper/lower bands (default: disabled).
RVWAP 1–3 Band Multiplier: Adjust the standard deviation multiplier for bands (default: 1.0).
VWAP Label Settings
Show VWAP % Difference Labels: Enable/disable percentage difference labels for all VWAPs (default: enabled, showing AVWAP 1 label).
VWAP Label Font Size (8–20): Adjust the font size for VWAP labels (default: 10, mapped to “tiny”).
How It Works
EMAs: Calculated using ta.ema(close, length) for each user-defined period. Percentage differences are computed as ((close - ema) / close) * 100 and displayed as labels for visible EMAs when show_ema_labels is enabled.
Anchored VWAPs: Calculated using ta.vwap(source, anchor, 1), where the anchor is determined by the selected timeframe (Session, Week, or Month). Bands are computed using the standard deviation from ta.vwap.
Rolling VWAPs: Calculated using ta.vwap(source, length), with bands based on ta.stdev(source, length).
Labels: Updated on each new bar (ta.barssince(ta.change(time) != 0) == 0) to show percentage differences. Labels are only displayed for visible EMAs/VWAPs to avoid clutter.
Color Matching: VWAP labels use the same color as their corresponding VWAP lines, set via input settings (e.g., avwap1_color for AVWAP 1).
Example Use Cases
- Trend Following: Use longer EMAs (e.g., 100, 200) to identify trends and shorter EMAs (e.g., 3, 9) for entry/exit signals.
- Mean Reversion: Monitor percentage difference labels to spot overbought/oversold conditions relative to EMAs or VWAPs.
- VWAP Trading: Use the default session-anchored AVWAP 1 for intraday trading, adding weekly/monthly VWAPs or rolling VWAPs for broader context.
- Intraday Analysis: Leverage the session-anchored AVWAP 1 (enabled by default) for day trading, with bands as support/resistance zones.
Overview
The EMA/VWAP Suite is a versatile and customizable Pine Script indicator designed for traders who want to combine Exponential Moving Averages (EMAs) and Volume Weighted Average Prices (VWAPs) in a single, powerful tool. It overlays up to eight EMAs and six VWAPs (three anchored, three rolling) on the chart, each with percentage difference labels to show how far the current price is from these key levels. This indicator is perfect for technical analysis, supporting strategies like trend following, mean reversion, and VWAP-based trading.
By default, the indicator displays eight EMAs and a session-anchored VWAP (AVWAP 1, in fuchsia) with their respective percentage difference labels, keeping the chart clean yet informative. Other VWAPs and their bands are disabled by default but can be enabled and customized as needed. The suite is designed to minimize clutter while providing maximum flexibility for traders.
Features
- Eight Customizable EMAs: Plot up to eight EMAs with user-defined lengths (default: 3, 9, 19, 38, 50, 65, 100, 200), each with a unique color for easy identification.
- EMA Percentage Difference Labels: Show the percentage difference between the current price and each EMA, displayed only for visible EMAs when enabled.
- Three Anchored VWAPs: Plot VWAPs anchored to the start of a session, week, or month, with customizable source, offset, and band multipliers. AVWAP 1 (session-anchored, fuchsia) is enabled by default.
- Three Rolling VWAPs: Plot VWAPs calculated over fixed periods (default: 20, 50, 100), with customizable source, offset, and band multipliers.
- VWAP Bands: Optional upper and lower bands for each VWAP, based on standard deviation with user-defined multipliers.
- VWAP Percentage Difference Labels: Display the percentage difference between the current price and each VWAP, shown only for visible VWAPs. Enabled by default to show the AVWAP 1 label.
- Customizable Colors: Each VWAP has a user-defined color via input settings, with labels matching the VWAP line colors (e.g., AVWAP 1 defaults to fuchsia).
Flexible Display Options: Toggle individual EMAs, VWAPs, bands, and labels on or off to reduce chart clutter.
Settings
The indicator is organized into intuitive setting groups:
EMA Settings
Show EMA 1–8: Toggle each EMA on or off (default: all enabled).
EMA 1–8 Length: Set the period for each EMA (default: 3, 9, 19, 38, 50, 65, 100, 200).
Show EMA % Difference Labels: Enable/disable percentage difference labels for all EMAs (default: enabled).
EMA Label Font Size (8–20): Adjust the font size for EMA labels (default: 10, mapped to “tiny”).
Anchored VWAP 1–3 Settings
Show AVWAP 1–3: Toggle each anchored VWAP on or off (default: AVWAP 1 enabled, others disabled).
AVWAP 1–3 Color: Set the color for each VWAP line and its label (default: fuchsia for AVWAP 1, purple for AVWAP 2, teal for AVWAP 3).
AVWAP 1–3 Anchor: Choose the anchor period (“Session,” “Week,” “Month”; default: Session for AVWAP 1, Week for AVWAP 2, Month for AVWAP 3).
AVWAP 1–3 Source: Select the price source (default: hlc3).
AVWAP 1–3 Offset: Set the horizontal offset for the VWAP line (default: 0).
Show AVWAP 1–3 Bands: Toggle upper/lower bands (default: disabled).
AVWAP 1–3 Band Multiplier: Adjust the standard deviation multiplier for bands (default: 1.0).
Rolling VWAP 1–3 Settings
Show RVWAP 1–3: Toggle each rolling VWAP on or off (default: disabled).
RVWAP 1–3 Color: Set the color for each VWAP line and its label (default: navy for RVWAP 1, maroon for RVWAP 2, fuchsia for RVWAP 3).
RVWAP 1–3 Period Length: Set the period for the rolling VWAP (default: 20, 50, 100).
RVWAP 1–3 Source: Select the price source (default: hlc3).
RVWAP 1–3 Offset: Set the horizontal offset (default: 0).
Show RVWAP 1–3 Bands: Toggle upper/lower bands (default: disabled).
RVWAP 1–3 Band Multiplier: Adjust the standard deviation multiplier for bands (default: 1.0).
VWAP Label Settings
Show VWAP % Difference Labels: Enable/disable percentage difference labels for all VWAPs (default: enabled, showing AVWAP 1 label).
VWAP Label Font Size (8–20): Adjust the font size for VWAP labels (default: 10, mapped to “tiny”).
How It Works
EMAs: Calculated using ta.ema(close, length) for each user-defined period. Percentage differences are computed as ((close - ema) / close) * 100 and displayed as labels for visible EMAs when show_ema_labels is enabled.
Anchored VWAPs: Calculated using ta.vwap(source, anchor, 1), where the anchor is determined by the selected timeframe (Session, Week, or Month). Bands are computed using the standard deviation from ta.vwap.
Rolling VWAPs: Calculated using ta.vwap(source, length), with bands based on ta.stdev(source, length).
Labels: Updated on each new bar (ta.barssince(ta.change(time) != 0) == 0) to show percentage differences. Labels are only displayed for visible EMAs/VWAPs to avoid clutter.
Color Matching: VWAP labels use the same color as their corresponding VWAP lines, set via input settings (e.g., avwap1_color for AVWAP 1).
Example Use Cases
- Trend Following: Use longer EMAs (e.g., 100, 200) to identify trends and shorter EMAs (e.g., 3, 9) for entry/exit signals.
- Mean Reversion: Monitor percentage difference labels to spot overbought/oversold conditions relative to EMAs or VWAPs.
- VWAP Trading: Use the default session-anchored AVWAP 1 for intraday trading, adding weekly/monthly VWAPs or rolling VWAPs for broader context.
- Intraday Analysis: Leverage the session-anchored AVWAP 1 (enabled by default) for day trading, with bands as support/resistance zones.
Script de código abierto
Fiel al espíritu de TradingView, el creador de este script lo ha convertido en código abierto, para que los traders puedan revisar y verificar su funcionalidad. ¡Enhorabuena al autor! Aunque puede utilizarlo de forma gratuita, recuerde que la republicación del código está sujeta a nuestras Normas internas.
Exención de responsabilidad
La información y las publicaciones no constituyen, ni deben considerarse como asesoramiento o recomendaciones financieras, de inversión, de trading o de otro tipo proporcionadas o respaldadas por TradingView. Más información en Condiciones de uso.