OPEN-SOURCE SCRIPT
Actualizado Period Separator & Candle OHLC
This script combines two powerful tools for traders: period separators and custom timeframe-based OHLC (Open, High, Low, Close) data visualization. Here's what it does:
Period Separators:
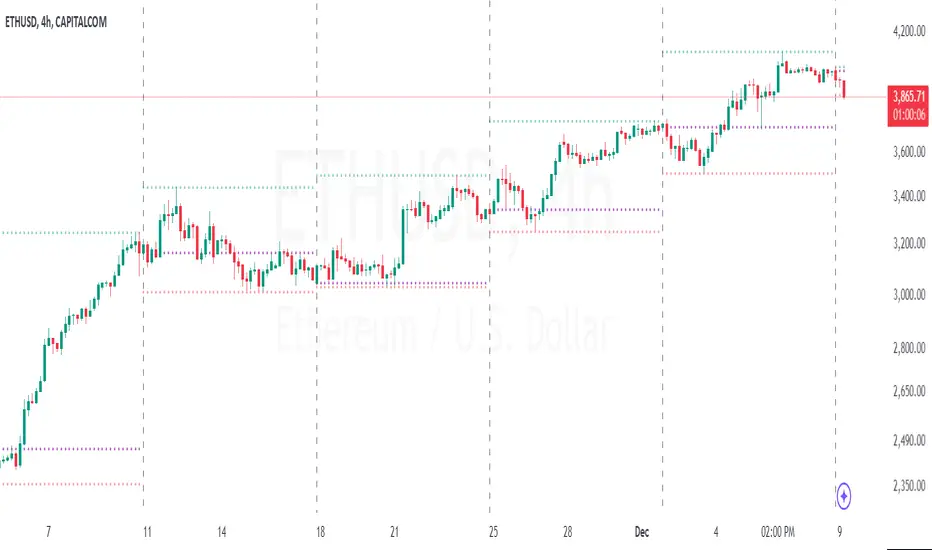
The script draws vertical lines to indicate the start of new time periods based on a user-defined timeframe (e.g., hourly, daily, weekly).
Users can customize the separator color, line style (solid, dashed, dotted), and width to suit their preferences.
Fetches OHLC data from a higher or custom timeframe (e.g., 4 hours) and overlays it on the current chart.
Users can choose to display the open, high, low, and close prices as dots or circles for easy visualization.
Optionally, the open and close dots can be visually connected with a filled bar for a candlestick-like effect.
The script color-codes the close price relative to the open (green if higher, red if lower) to highlight price direction at a glance.
Fully Customizable:
Users have full control over which OHLC values to display and whether the dots should be filled.
Transparency settings for plotted dots and fills are also adjustable for optimal visibility on different chart styles.
How It Is Useful for Trading:
Timeframe Analysis:
The period separators make it easy to distinguish trading activity across custom time intervals. This is crucial for intraday, swing, and long-term traders who analyze price movements within specific periods.
Multi-Timeframe Insights:
By overlaying OHLC data from a higher timeframe on a lower timeframe chart, traders can identify key support and resistance levels, pivots, and trends that are not immediately visible on the current timeframe.
Trend Recognition:
The color-coded close dots (green for bullish, red for bearish) provide an instant visual cue of market sentiment, helping traders confirm or refute their bias.
Whether you're a scalper, day trader, or position trader, the flexibility in timeframe selection, styling, and data presentation ensures this tool can adapt to your trading strategy.
Period Separators:
The script draws vertical lines to indicate the start of new time periods based on a user-defined timeframe (e.g., hourly, daily, weekly).
Users can customize the separator color, line style (solid, dashed, dotted), and width to suit their preferences.
Fetches OHLC data from a higher or custom timeframe (e.g., 4 hours) and overlays it on the current chart.
Users can choose to display the open, high, low, and close prices as dots or circles for easy visualization.
Optionally, the open and close dots can be visually connected with a filled bar for a candlestick-like effect.
The script color-codes the close price relative to the open (green if higher, red if lower) to highlight price direction at a glance.
Fully Customizable:
Users have full control over which OHLC values to display and whether the dots should be filled.
Transparency settings for plotted dots and fills are also adjustable for optimal visibility on different chart styles.
How It Is Useful for Trading:
Timeframe Analysis:
The period separators make it easy to distinguish trading activity across custom time intervals. This is crucial for intraday, swing, and long-term traders who analyze price movements within specific periods.
Multi-Timeframe Insights:
By overlaying OHLC data from a higher timeframe on a lower timeframe chart, traders can identify key support and resistance levels, pivots, and trends that are not immediately visible on the current timeframe.
Trend Recognition:
The color-coded close dots (green for bullish, red for bearish) provide an instant visual cue of market sentiment, helping traders confirm or refute their bias.
Whether you're a scalper, day trader, or position trader, the flexibility in timeframe selection, styling, and data presentation ensures this tool can adapt to your trading strategy.
Notas de prensa
The indicator script has been updated to show historical and present data for the period separator lines, as well as the high and low lines. This means that you can either choose to see only the current period separator or show all past separators. I also added labels for the high and the low lines.Next update would be to implement the same logic to the open and close lines.
Script de código abierto
In true TradingView spirit, the creator of this script has made it open-source, so that traders can review and verify its functionality. Kudos to the author! While you can use it for free, remember that republishing the code is subject to our House Rules.
Exención de responsabilidad
The information and publications are not meant to be, and do not constitute, financial, investment, trading, or other types of advice or recommendations supplied or endorsed by TradingView. Read more in the Terms of Use.